
Figure 5.
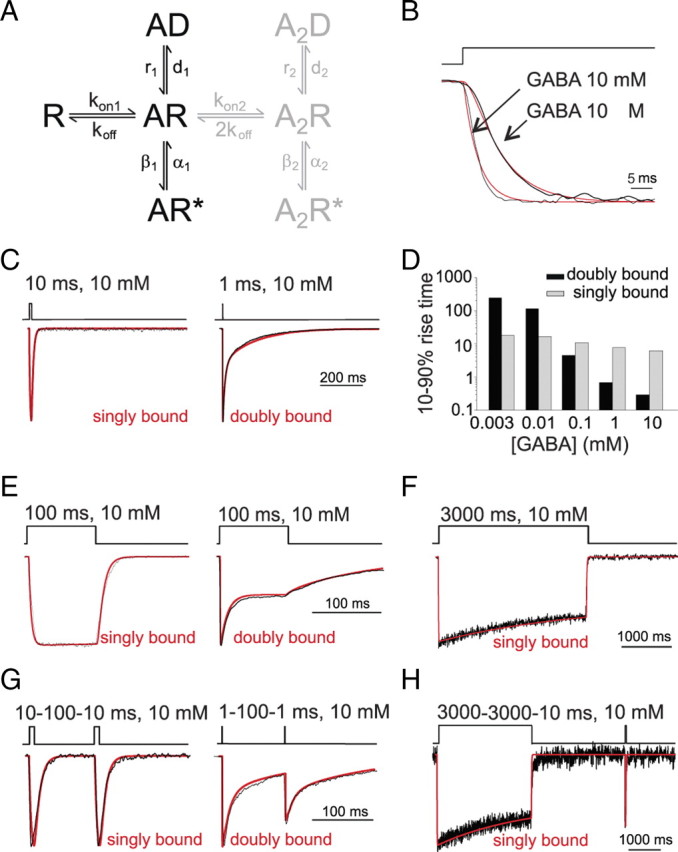
Model simulation of α1β1γ2 (doubly bound) and α1α1F64Cβ1γ2 (singly bound) gating properties. A, Gating scheme for GABAA receptor (Jones and Westbrook, 1995). In the present study, singly bound currents were simulated by using the R, AR, AR*, and AD states (in black). Doubly bound currents were simulated by adding the A2R, A2R* and A2D states (in gray). The rate constants used were: kon1 = 2.877 ± 0.177 ms−1 mm−1, koff = 0.267 ± 0.021 ms−1, β1 = 0.086 ± 0.007 ms−1, α1 = 0.208 ± 0.016 ms−1, d1 = 0.00023 ± 0.00002 ms−1, r1 = 0.00035 ± 0.00003 ms−1, kon2 = 18.29 ms−1 mm−1, β2 = 8.85 ms−1, α2 = 0.42 ms−1, d2 = 1.32 ms−1, r2 = 0.032 ms−1. B, Simulated (red) and experimental (black) onset of currents evoked by saturating and low GABA concentrations (as indicated) from singly bound receptors. C, Simulated (red) and experimental (black) currents showing the deactivation kinetics for singly and doubly bound receptor-mediated currents. D, Summary of simulated 10–90% rise-time dependence on the GABA concentration for singly and doubly bound receptor configurations. E, Simulated (red) desensitization for doubly and singly bound currents superimposed to experimental traces (black). F, Simulated and experimental currents (red and black, respectively), showing slow desensitization onset for singly bound currents. Doubly bound currents are not shown since more doubly bound desensitized state must be included in the model to adequately reproduce desensitization evoked by long GABA pulses. G, Recovery from desensitization using paired pulse protocol for simulated (red) and experimental currents (black). H, Recovery from desensitization of simulated (red) and experimental traces (black) after long conditioning pulses for singly bound currents. Note that in B–H, traces are normalized for better visualization of kinetic differences.