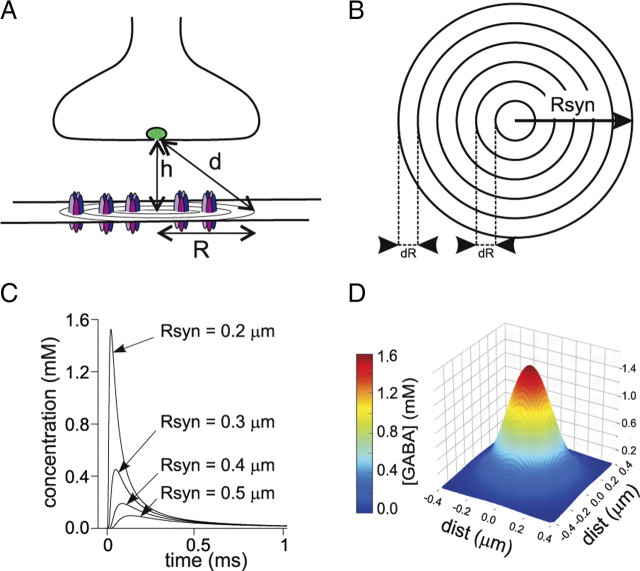
Figure 6.
Model simulation of GABA diffusion in the synaptic cleft. A, Diagram of a GABAergic synapse. The distance from the releasing site to the synaptic disk is indicated by d (see Materials and Methods). B, Schematic representation of the synaptic disk. The disk area was divided into shells with step dR and the relative contribution of the receptors located in each of them was computed (see Materials and Methods). C, Example of three [GABA] temporal profiles at increasing distances from the disk center (0.2, 0.3 and 0.4 μm) obtained by the simulated release of 4000 GABA molecules. D, GABA concentration spatial distribution at 0.03 ms after release.

