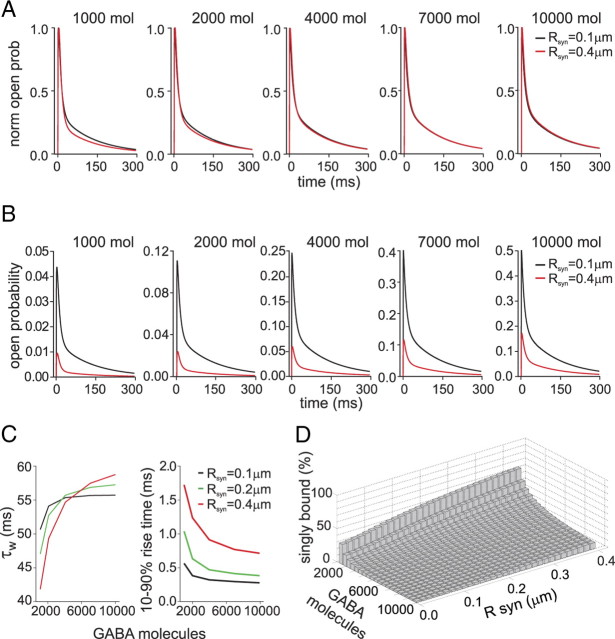
Figure 7.
Simulated postsynaptic responses elicited by concentration transients obtained by GABA diffusion in the cleft. A, Simulated postsynaptic responses obtained by release of different GABA molecule number. In black, responses obtained at synapses with synaptic disk radius = 0.1 μm; in red responses obtained at synapses with synaptic disk radius = 0.4 μm. Note that the traces were normalized, to visualize difference in the decay kinetics. B, Open probability of the same traces as in A. C, Summary of the mean time constant (left) and 10–90% rise time (right) dependence upon the number of GABA molecules released at synapses with synaptic disk radius = 0.1 (black), 0.20 (green) and 0.4 (red) μm, respectively. D, Three-dimensional plot summarizing the simulated relative contribution of the singly bound open state at different GABA molecule numbers and synaptic radiuses.

