
Figure 6.
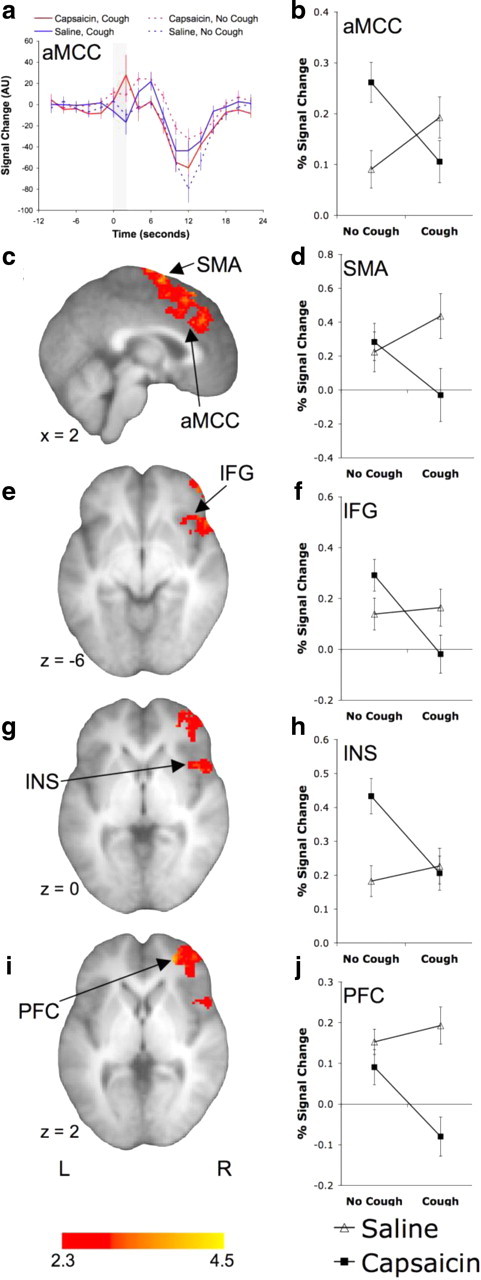
Brain regions showing a negative interaction between cough and capsaicin. The anterior mid-cingulate cortex (aMCC) showing the BOLD signal time course (a) and the mean (±SE) percentage BOLD signal change (b) during each of the four conditions. The shaded region of a represents the timing of cough events. The statistical parametric maps and percentage BOLD signal change for the supplementary motor area (SMA) (c, d), inferior frontal gyrus (IFG) (e, f), mid/anterior insula (INS) (g, h), and prefrontal cortex (PFC) (i, j). See Table 5 for a list of activated regions.