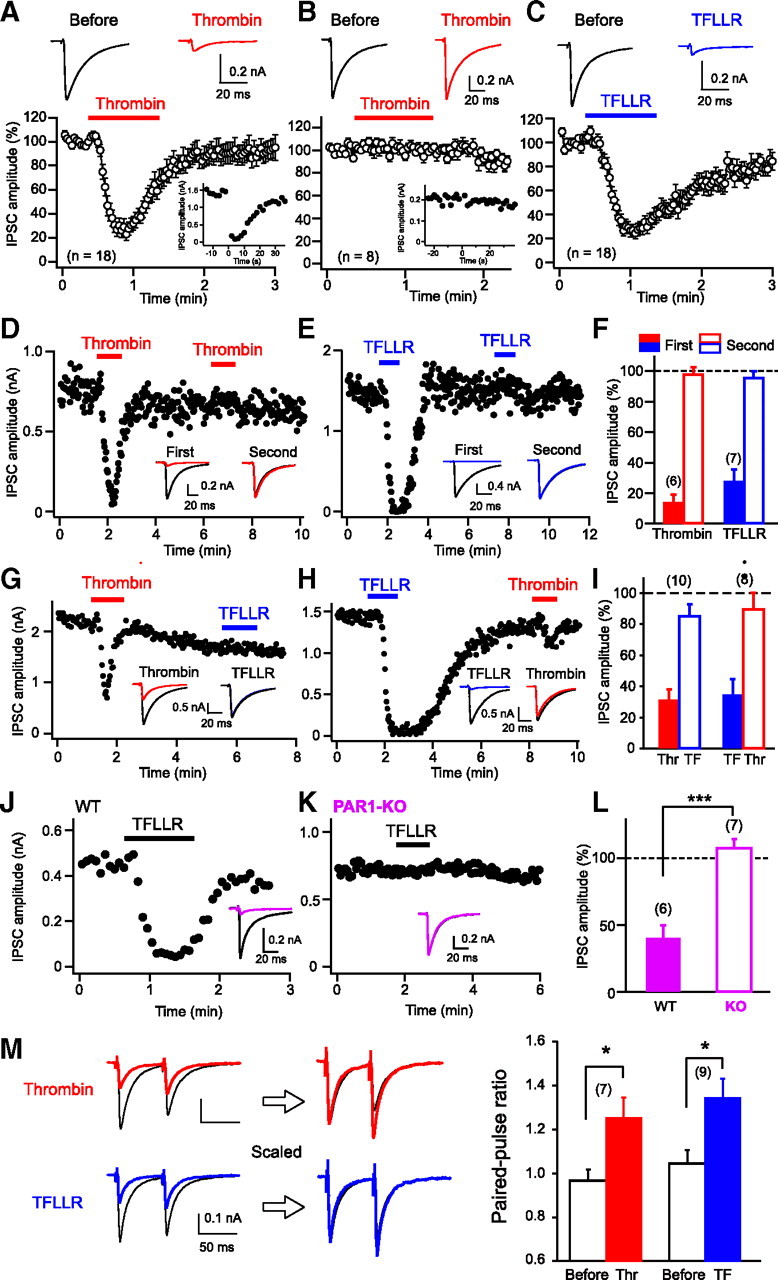
Figure 1.

Thrombin and PAR1 agonists induce transient suppression of IPSCs. A–C, Top, Representative IPSC traces before (left) and during (right) application of thrombin (1 U/ml, red) or TFLLR (10 μm, blue). Each trace is the average of five IPSCs. Bottom, Normalized IPSC time course during application of PAR1 activators. Data were obtained from cannabinoid-sensitive (A, C) and cannabinoid-insensitive (B) IPSCs. Insets, Representative data showing positive (A) and negative (B) DSI responses. A depolarizing pulse (5 s, 0 mV) was applied to the postsynaptic neuron at time 0. D–F, Representative experiments (D, E) and summary bar graph (F) for the effects of repeated application of thrombin or TFLLR. Two IPSC traces acquired before (black) and during application of thrombin (red) or TFLLR (blue) are superimposed in each sample record in insets. G–I, Effects of sequential application of thrombin (Thr) and TFLLR (TF), illustrated as in D–F. J–L, Effects of TFLLR (10 μm) on IPSCs in wild-type (WT) and PAR1-knock-out (KO) mice. Two IPSC traces acquired before (black) and during (pink) application of thrombin or TFLLR are superimposed in each sample record in insets. M, Left, Examples of IPSC traces in response to paired stimuli (60 ms interval) before (black) and during application of thrombin (red) or TFLLR (blue). Right, Averaged data for the increase in paired-pulse ratio by thrombin and TFLLR. Numbers in parentheses represent the number of tested cells. *p < 0.05, ***p < 0.001. All data are presented as mean ± SEM.
