
Figure 3.
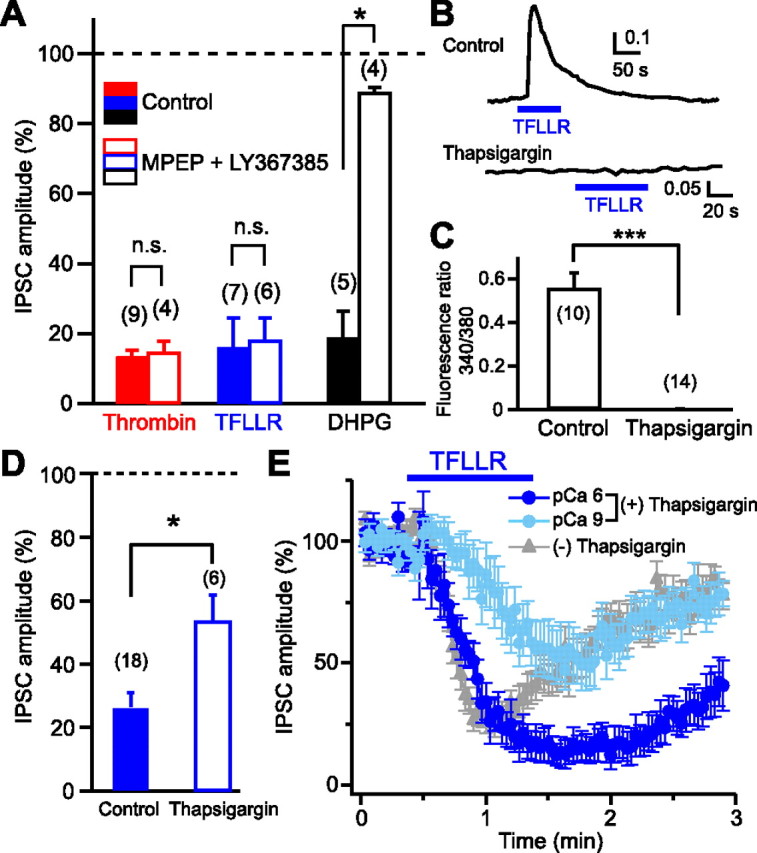
Neuronal PAR1, rather than glial PAR1, is responsible for generation of 2-AG signaling. A, Normalized IPSC amplitudes during application of thrombin (1 U/ml), TFLLR (10 μm), and DHPG (20 μm) in the presence (open columns) or absence (filled columns) of a mixture of MPEP (5 μm) and LY367385 (100 μm). B, C, Representative data (B) and summary graph (C) showing complete suppression of TFLLR-induced Ca2+ elevation in glial cells by thapsigargin (1 μm). D, Normalized IPSC amplitudes during application of TFLLR (10 μm) after treatment with thapsigargin (1 μm) for 1 h (open column). The control data without thapsigargin-treatment (filled column) (see Fig. 2F) are shown for comparison. E, TFLLR-induced IPSC suppression was dependent on postsynaptic Ca2+ concentration. After treatment with thapsigargin (1 μm, 1 h), TFLLR (10 μm) was applied to the postsynaptic neurons dialyzed with two different pipette solutions, pCa 6 (n = 7) and pCa 9 (n = 8). Results from nontreated neurons (Fig. 1C) were superimposed (gray triangles). Numbers in parentheses represent the number of tested cells. *p < 0.05; ***p < 0.001. All data are presented as mean ± SEM. n.s., Not significant.