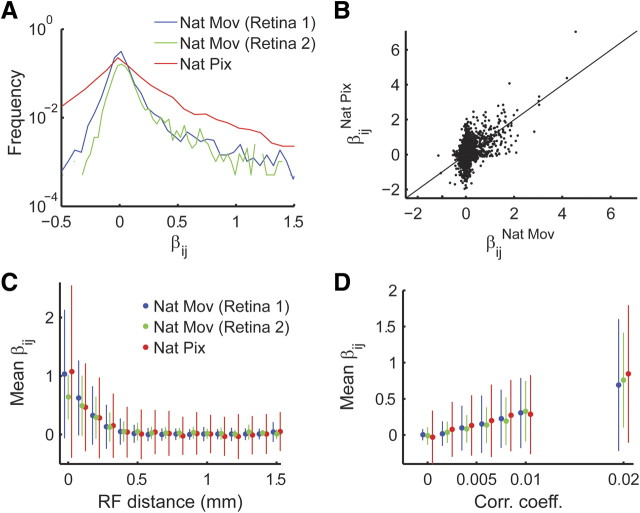
Figure 3.
Pairwise interactions distribution and their relation to distance and correlation between cells. A, Histogram of interactions derived from population models of retinal ganglion cells responding to natural pixel (Nat Pix; red; see Materials and Methods) and natural movie (Nat Mov) stimuli. The interaction values of the model presented in Figure 2, A and B, are shown in blue (retina 1), and those from the model in Figure 2, C and D, are in green (retina 2). B, Network interactions under different stimulus conditions. The functional interaction values (as measured by the parameter β in the pairwise model) for a natural movie stimulus (abscissa; same as in Fig. 1A) are plotted against the values obtained for the same pairs of recording electrodes under natural pixel stimulation (full-field stimulus with natural temporal statistics; see Materials and Methods; ordinate). Line marks identity. C, Average pairwise interaction plotted against receptive field (RF) distance (bars represent SD; colors as in A). D, Average pairwise interaction magnitude plotted against correlation coefficient (bars represent SD; colors as in A).

