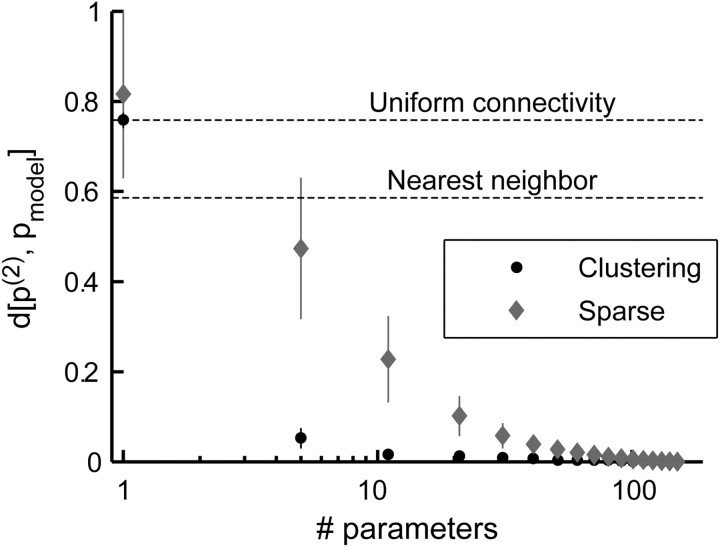
Figure 7.
Reduced exponential models for the distribution of network activity patterns. The average scaled divergence (error bars represent SD) from the full pairwise model is plotted against the number of interaction parameters allowed in the model, for 32 randomly chosen networks of 20 neurons. Interactions were either clustered together and forced to take the same value (black circles; for details, see Results) or added according to the absolute interaction strength (gray diamonds; as described in Results). A scaled divergence of 1 represents a model that is identical to the independent model, whereas a scaled divergence of 0 represents a model that is identical to the pairwise model (see Materials and Methods). Average scaled divergence for the uniform connectivity (clustering with one allowed value) and first-order nearest-neighbor models are also shown for comparison. Note that the x-axis is on a log scale and that the full pairwise model consists of 190 different interactions.

