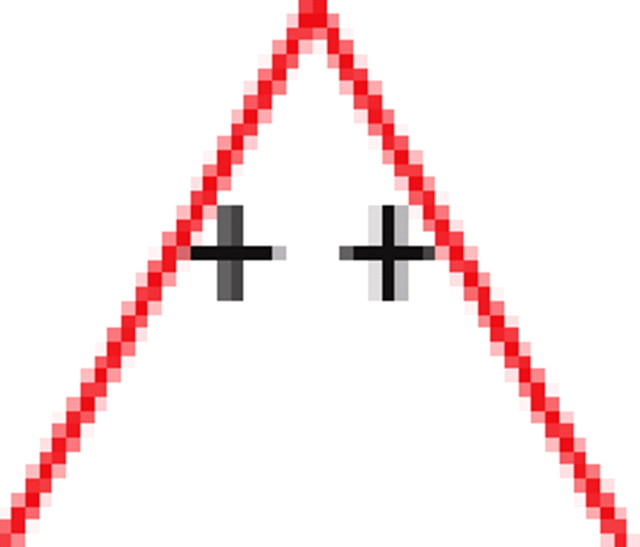
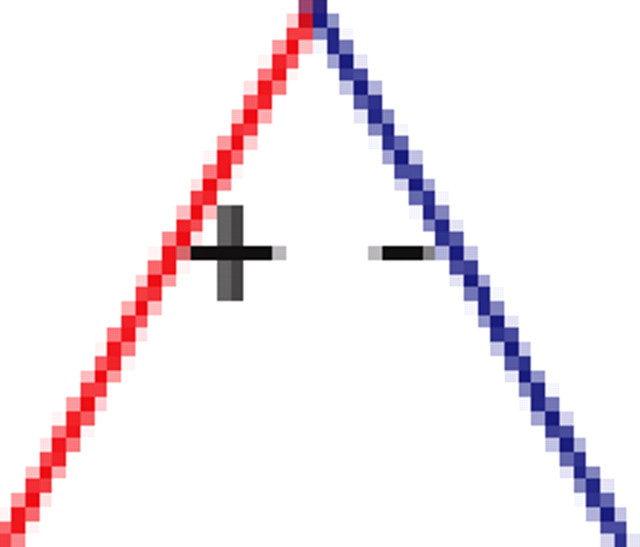
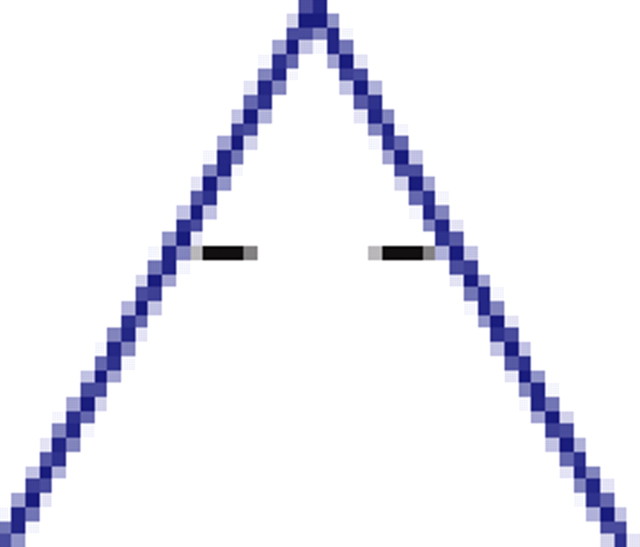
Table 1.
Motifs and anti-motifs in the functional interaction network
| Subgraph |
p values |
|||||
|---|---|---|---|---|---|---|
| 500 edges |
1000 edges |
2000 edges |
||||
| Motif | Anti-motif | Motif | Anti-motif | Motif | Anti-motif | |
 |
<10−3 | <10−3 | <10−3 | |||
| <10−3 | <10−3 | <10−3 | ||||
 |
<10−3 | |||||
| <0.01 | <10−3 | <10−3 | ||||
 |
<10−3 | <10−3 | <10−3 | |||
| <10−3 | <10−3 | <10−3 | ||||
 |
<0.01 | <10−3 | ||||
| <10−3 | <10−3 | <10−3 | ||||
 |
<10−3 | <10−3 | <10−3 | |||
| <10−3 | <10−3 | <10−3 | ||||
 |
<10−3 | <10−3 | <0.05 | |||
| <10−3 | <10−3 | <10−3 | ||||
 |
<10−3 | <10−3 | <0.01 | |||
| <0.1 | <0.01 | <10−3 | ||||
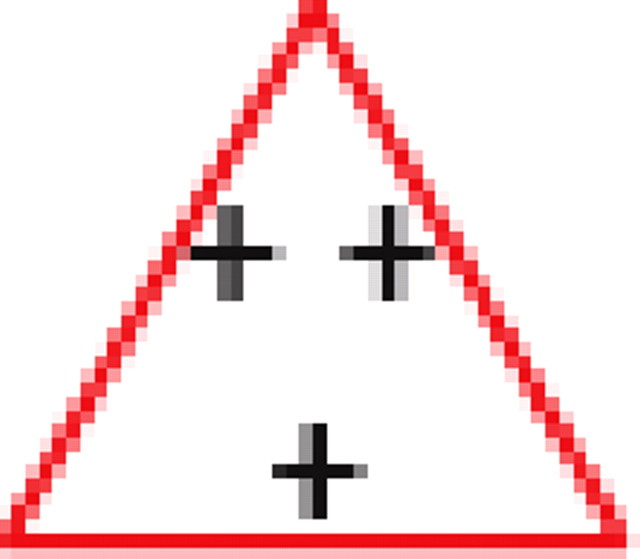
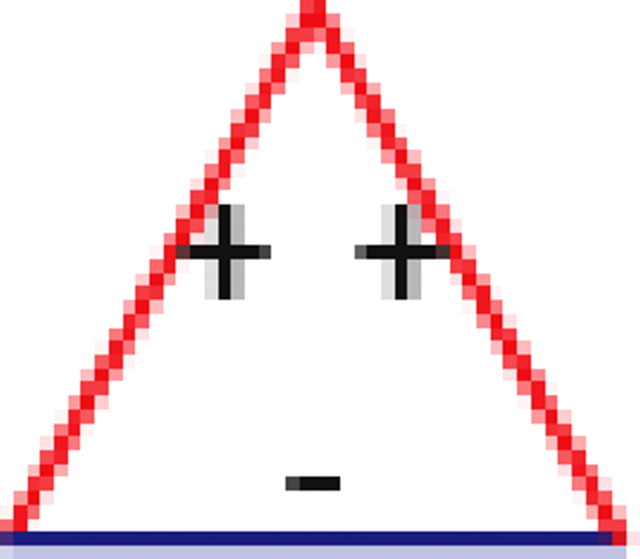
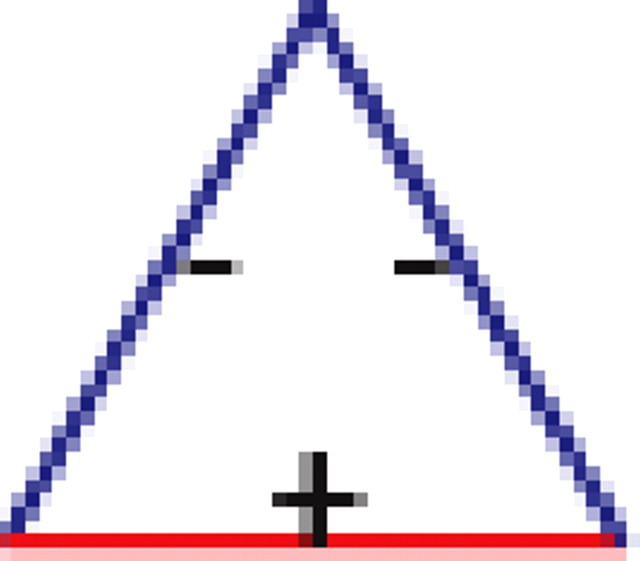
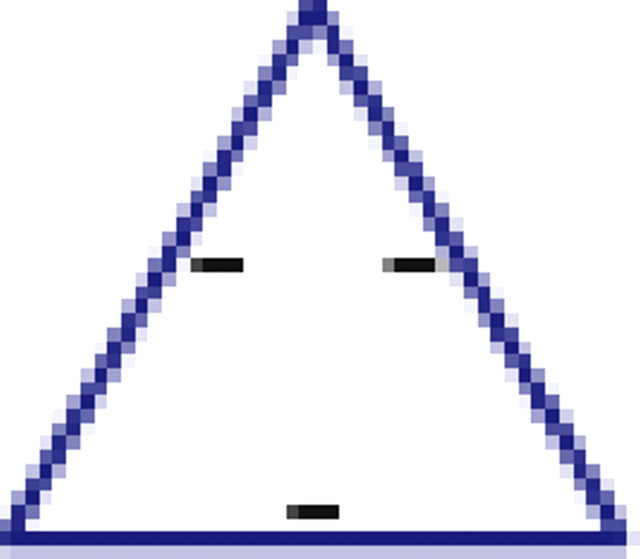
p values for the frequency of appearance of the seven possible two-colored connected triplets are shown for two stimuli presented to the same retina (natural movie, top rows; natural pixel movie, bottom rows; empty entries correspond to nonsignificant values).
