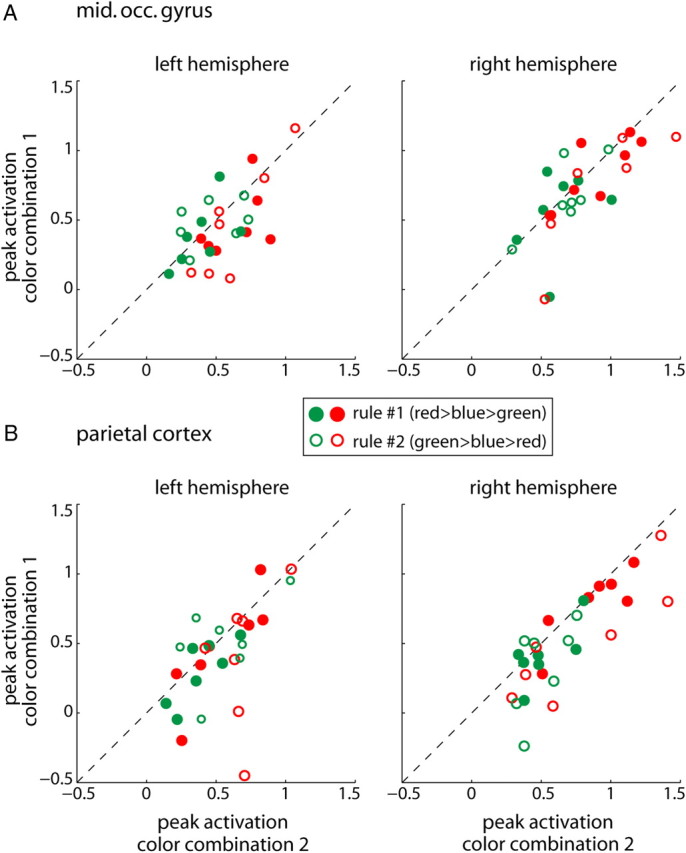
Figure 10.

Unilateral versus bilateral representation of space. A, Peak normalized activations in the left and right middle occipital gyri for red (red circles) and green (green circles) contralateral stimuli. Depicted are peak activations during trials where the contralateral stimulus is kept constant (red or green) while the ipsilateral stimulus varies (color combination 1 vs 2; see text for details and p values). Closed circles represent rule #1, open circles rule #2. The dashed line is the unity line. B, The same as in A for the parietal cortex.
