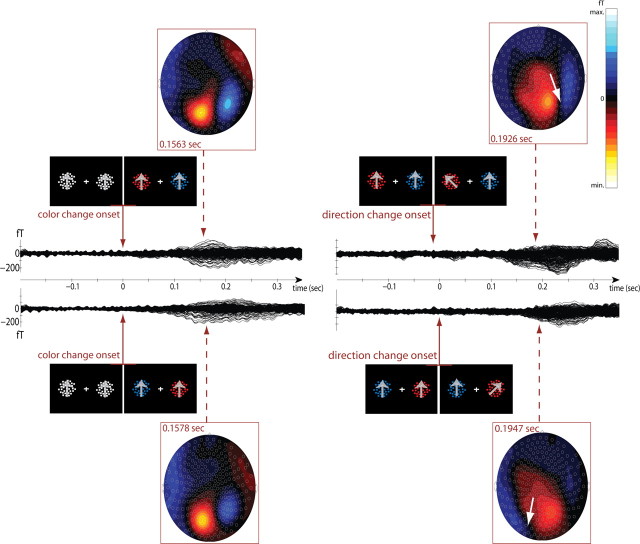
Figure 2.
Example subject MEG data. Top, Single subject's average magnetic field activity as a function of time from color change onset (left) and direction change onset (right) when the target (here, the red RDP) was in the left visual field. Activity at all sensors is overlaid. Bottom, The same as above for changes in targets that were positioned in the right visual field. MEG maps display magnetic field topographies at indicated latencies.

