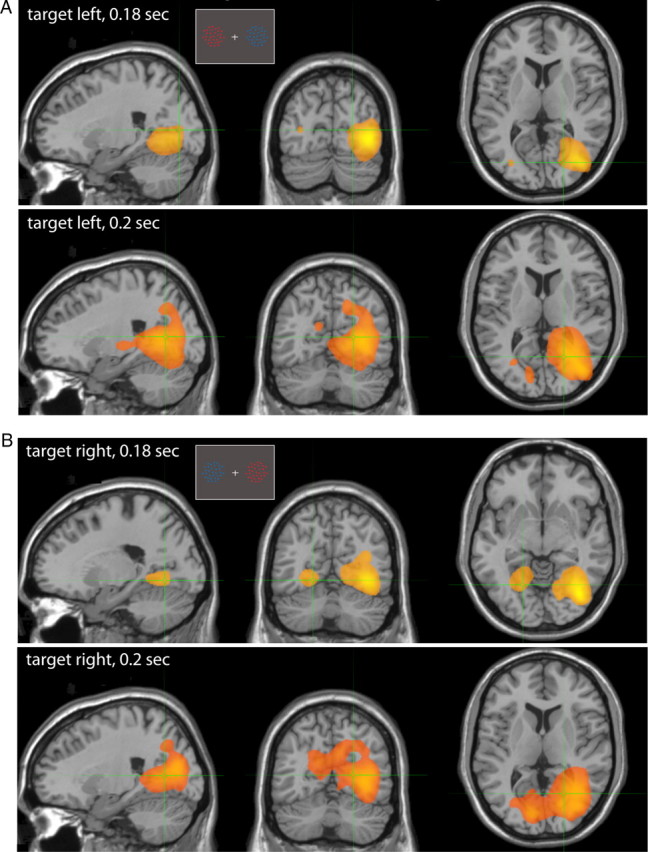
Figure 3.

Target selection: group erSAM analysis. A, B, Sagittal, coronal, and axial views of brain regions maximally activated (yellow) when the target is positioned on the left (A) or right (B) at latencies of 180 ms (top) and 200 ms (bottom) from color cue onset. Insets represent example stimulus configurations.
