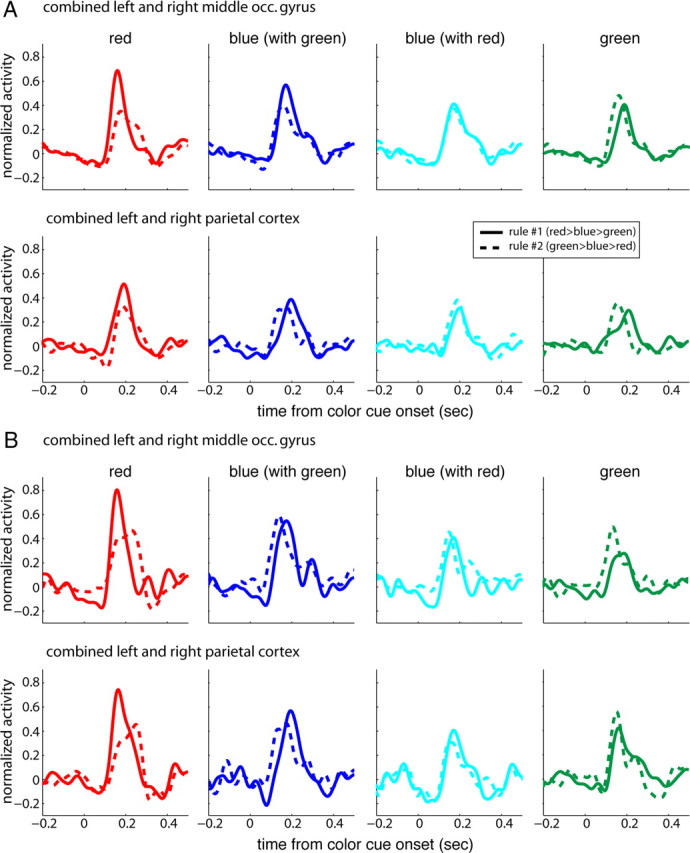
Figure 4.

Target selection: ERFs as a function of color. A, Average normalized activity combined across hemispheres and subjects (7 subjects for each rule) as a function of time from color cue onset. Panels from left to right represent contralateral stimulus colors red, blue (when paired with green), blue (when paired with red), and green; solid lines indicate rule #1, dashed lines rule #2. Note that the ranks of the red and green stimuli vary with rule. Top row, Middle occipital gyrus; bottom row, parietal cortex. B, The same as in A across two subjects who had participated at sessions of rule #1 and were then retested using rule #2.
