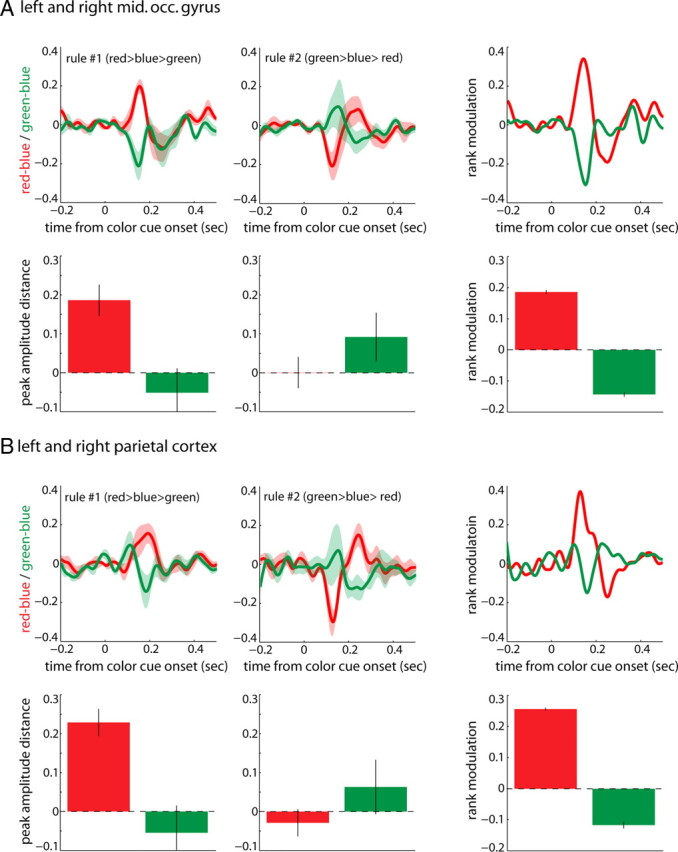
Figure 5.

Target selection: distance to blue. A, Average distance of red and green stimuli to blue (invariant rank 2) combined across left and right middle occipital (mid. occ.) gyri. Top, left and right, represents distance as a function of time from color cue onset for rule #1 and rule #2, respectively. The bar graphs below depict the distance in single subjects' peak amplitudes. Rightmost panels represent the magnitude of rank modulation across both rules (distance rule #1 minus distance rule #2). Shaded areas and black lines are SEM. B, The same as in A for the parietal cortex.
