Figure 7.
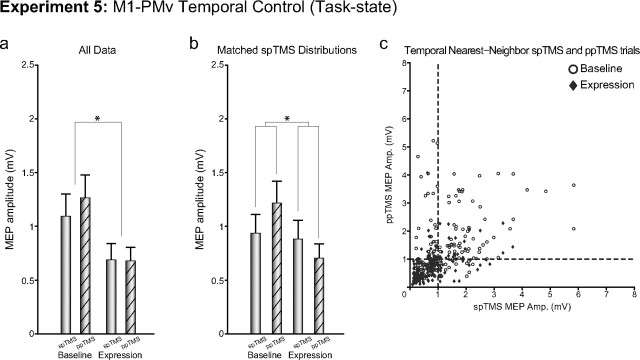
Experiment 5. The figure shows group mean MEP amplitudes measured with either spTMS over M1 or ppTMS over PMv and then, with an 8 ms IPI, M1 before (baseline) and after (expression) plasticity induction in the M1-to-PMv pathway [the opposite order of stimulation of PMv and M1 was used in Experiments 3 (Fig. 5) and 5 (here)]. Measurements were taken while the subject initiated reaching and grasping movements. a, b, Data from all trials (a) and after matching of spTMS MEP sizes in the baseline and expression periods (b) are shown. c, spTMS trials are plotted against temporal nearest-neighbor ppTMS trials for baseline and expression blocks for all subjects. *p < 0.05 (significant effects). Error bars represent 1 SEM.

