
Figure 2.
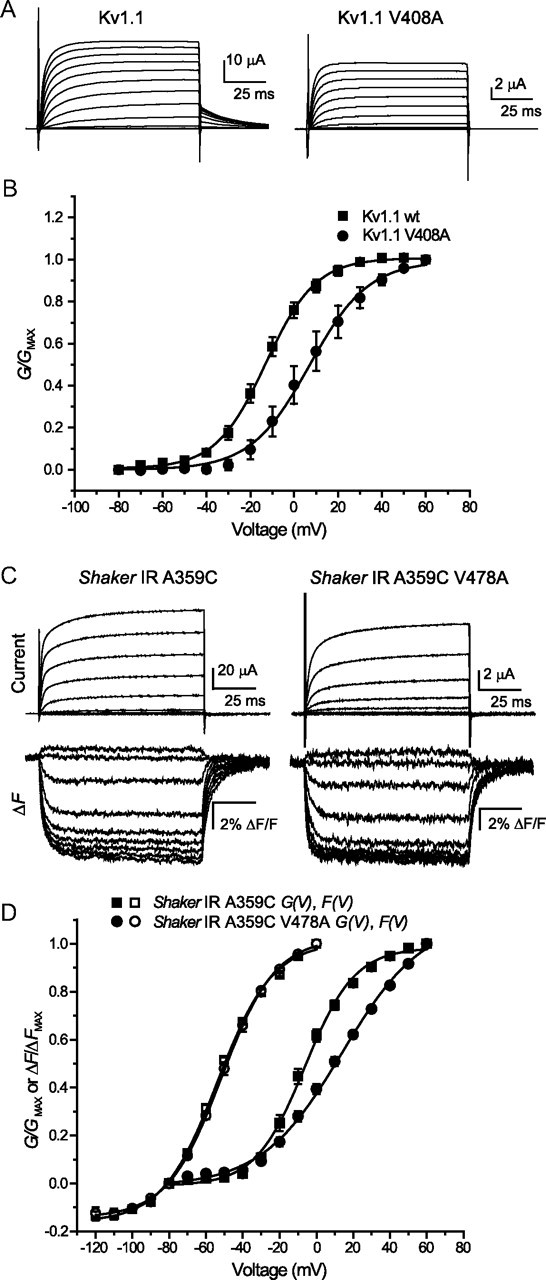
EA-1 mutants shift the voltage dependence of activation, but not of voltage sensor movement. A, Currents recorded in response to pulses from −80 to +60 mV, in 10 mV steps from a holding potential of −80 mV, in Kv1.1 and Kv1.1V408A. B, Steady-state conductance values calculated from currents in A are normalized and plotted against voltage, then fit with two state Boltzmann curves. Values of V1/2 and k for the G(V) curve of Kv1.1 were −12.7 ± 2.3 mV and 10.3 ± 0.6 mV, respectively, while for Kv1.1 V408A they were +5.49 ± 4.62 mV and +12.1 ± 1.1 mV. C, A protocol similar to the one shown in A is used to elicit outward currents from Shaker IR A359C and Shaker IR A359C V478A, while concurrently recording fluorescence from A359C modified by TMRM dye. For clarity, 20 mV steps are shown, for potentials from −100 through 60 mV. D, Steady-state conductance values and fluorescence signals from C are normalized and plotted against voltage. Conductance–voltage (G–V) curves are fit with single Boltzmann functions from −80 to +60 mV, whereas F(V) curves are fit from −120 to 0 mV. Values of V1/2 and k for the F(V) curve of Shaker IR A359C were −53.7 ± 1.1 mV and 15.0 ± 0.6 mV, respectively, while for F(V) of Shaker IR A359C V478A they were −51.6 ± 1.4 mV and 14.7 ± 0.9 mV, respectively. Values of V1/2 and k for the G(V) curve of Shaker IR A359C were −7.07 ± 2.57 mV and 13.7 ± 1.1 mV, respectively, while for G(V) of Shaker IR A359C V478A they were +9.60 ± 2.76 mV and 21.6 ± 0.7 mV, respectively. Where error bars are invisible they are contained within the data points.