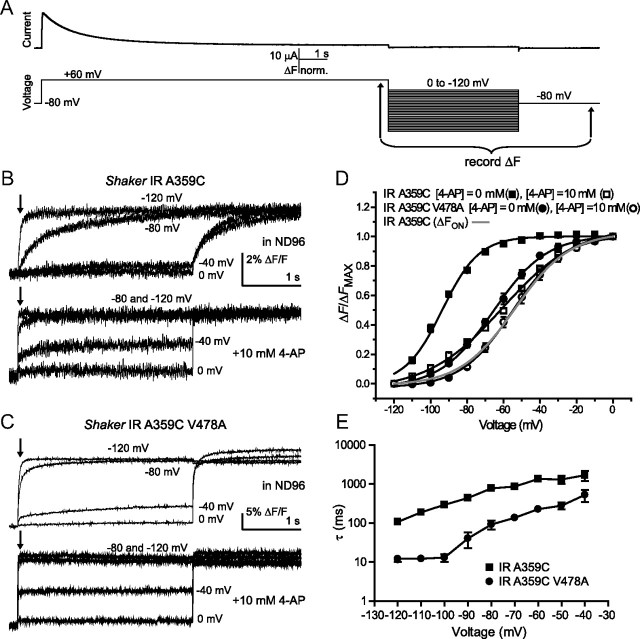
Figure 5.
V478A mutation prevents S4 charge immobilization in Shaker IR. A, Sample current (top) from a voltage protocol (bottom) to measure fluorescence immobilization (for explanation see text). Arrows indicate the period over which fluorescence signals in B and C were recorded. B, Fluorescence traces recorded during repolarization to the indicated potentials in Shaker IR A359C, in ND96 (top) and in ND96 with 10 mm 4-AP (bottom). Arrows indicate where ΔF/Fmax was measured for D. C, Fluorescence traces recorded during repolarization to the indicated potentials for Shaker IR A359C V478A. D, Fluorescence amplitudes 50 ms after start of repolarizing voltage pulses in B and C plotted against voltage and fit with single Boltzmann functions, in ND96 (filled symbols) and 10 mm 4-AP (open symbols). V1/2 values of Boltzmann fits for Shaker IR A359C fluorescence were −98.9 ± 1.5 mV with 0 mm 4-AP and −60.7 ± 1.5 mV with 10 mm 4-AP. V1/2 values of Boltzmann fits for Shaker IR A359C V478A fluorescence were −65.6 ± 1.4 mV with 0 mm 4-AP and −55.1 ± 2.1 mV with 10 mm 4-AP. A Boltzmann function fit to Shaker IR A359C fluorescence during activation pulses (from Fig. 2) is overlaid in gray (V1/2 = −53.7 ± 1.1 mV). E, Time constants fit at all potentials to repolarization fluorescence traces for Shaker IR A359C and A359C V478A. τ values were significantly different at all displayed potentials where they could be fit, p < 0.05.

