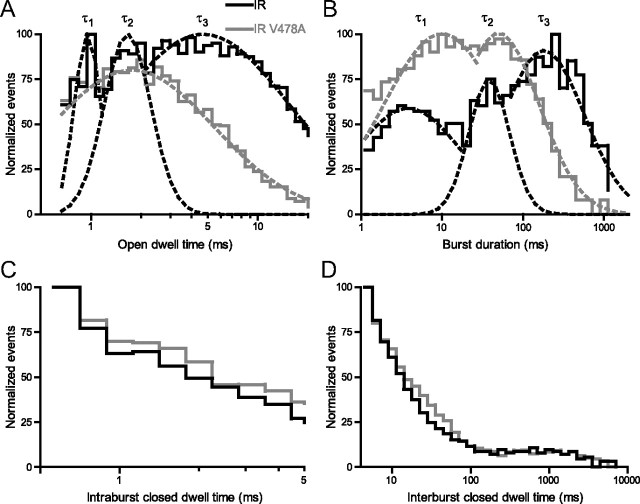
Figure 7.
Shaker IR V478A does not enter a long-lasting open state and has shorter bursts than Shaker IR. A, Frequency histogram of opening event durations normalized to maximum frequency and binned logarithmically by duration for currents from Shaker IR (black) and Shaker IR V478A (gray). Gaussian distributions fit to the peaks had mean time constants, for Shaker IR, of τ1 = 0.8 ± 0.1 ms, τ2 = 1.3 ± 0.1 ms, τ3 = 4.7 ± 0.9 ms, and for Shaker IR V478A, of τ1 = 0.8 ± 0.1 ms and τ2 = 1.4 ± 0.3 ms. B, Normalized frequency histogram of burst duration (single bursts delimited by closed intervals longer than 5 ms). Gaussian distributions fit to the peaks had mean time constants, for Shaker IR, of τ1 = 3.4 ± 0.1 ms, τ2 = 25.2 ± 4.0 ms, τ3 = 169.0 ± 15.5 ms, and for Shaker IR V478A, of τ1 = 9.9 ± 0.6 ms and τ2 = 98.3 ± 16.4 ms. C, Normalized frequency histogram of intraburst durations. Single Gaussian fits (data not shown) had mean time constants of 1.1 ± 0.1 ms and 1.3 ± 0.1 ms for Shaker IR and Shaker IR V478A, respectively. D, Normalized frequency histogram of interburst durations (denoted as closing events longer than 5 ms). These curves were not fit with Gaussian functions.

