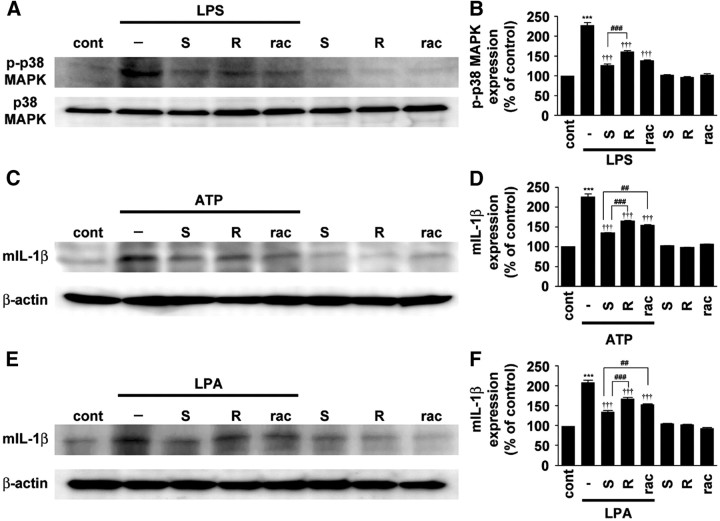
Figure 4.
Preferential inhibitory effects of S-ketamine on hyperactivation of cultured microglia following stimulation with ATP or LPA. A, C, E, The immunoblot analyses of p-p38 MAPK or mIL-1β in cultured MG6 microglia stimulated with LPS (100 ng/ml) (A), combination of LPS (100 ng/ml) and ATP (5 mm) (C), and LPA (10 μm) (E) in the presence of S- and R-ketamine and racemate. B, D, F, The quantitative analyses of p-p38 MAPK or mIL-1β in the stimulated MG6 microglial cells. Each column and vertical bar represent the mean ± SEM of three independent experiments. The asterisks indicate a statistically significant difference from control group (***p < 0.001). The daggers indicate a statistically significant difference from LPS-, LPS plus ATP-, or LPA-treated group (†††p < 0.001). The sharps indicate a statistically significant difference between the values (##p < 0.01; ###p < 0.001).

