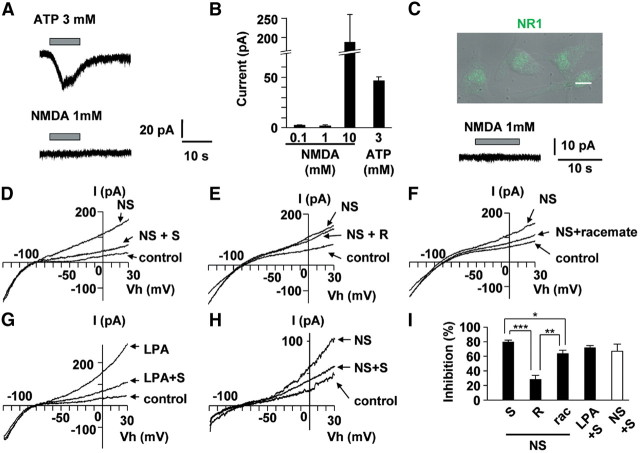
Figure 6.
Preferential inhibitory effects of S-ketamine on BK currents in cultured microglia. A, The typical traces show NMDA (100 μm) and ATP (3 mm) induced inward currents in cultured microglia. NMDA did not induce any currents, whereas ATP induced inward current at holding potential of −60 mV. B, The mean currents of 0.1 (n = 4), 1 (n = 3), and 10 mm (n = 3) NMDA or 3 mm ATP (n = 4) induced currents. Each column and vertical bar represent the mean and SEM. C, Overlaying differential interference contrast (DIC) and fluorescence images with CLSM of NR1 expression (green) in cultured microglia. Scale bar, 10 μm. NMDA (1 mm) did not induce inward currents in primary cultured microglia. D–F, The typical traces show the inhibition of S-ketamine (100 μm) (D), R-ketamine (100 μm) (E), and racemate (100 μm) (F) on NS1619 (20 μm) induced BK currents in cultured microglia. G, The typical traces show the inhibition of S-ketamine (100 μm) on LPA (1 μm) induced BK currents in cultured microglia. H, The typical traces show the inhibition of S-ketamine (100 μm) on NS1619 (20 μm)-induced BK currents in spinal microglia from slice preparation from naive mice. I, The mean inhibition rate of NS1619- or LPA-induced BK currents at +30 mV in the presence of ketamine in the cultured microglia (filled column) and in spinal microglia from slice preparations (open column). NS1619 (NS) + S-ketamine (S), n = 6; NS + R-ketamine (R), n = 3; NS + racemate (rac), n = 4; LPA + S, n = 3; NS + S, n = 5. Each column and vertical bar represent the mean ± SEM. The asterisks indicate a statistically significant difference between the values (*p < 0.05, **p < 0.01, ***p < 0.001).

