
Figure 7.
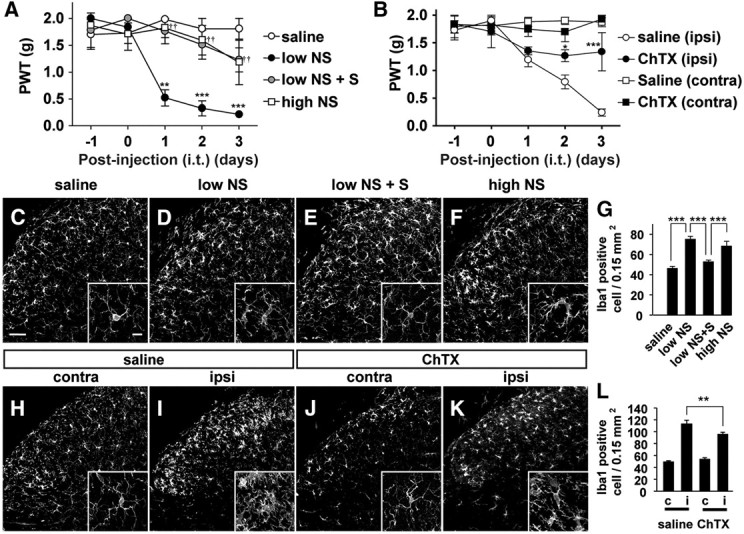
The possible involvement of BK channels in the development of tactile allodynia. A, The time course changes in the PWT after the intrathecal administration of saline, NS1619 with the low concentration (low NS; 20 μm, 0.072 μg/10 μl), combination of low NS with S-ketamine (S, 100 μm; 0.27 μg/10 μl, i.t.), and NS1619 with the high concentration (high NS; 5555 μm, 20 μg/10 μl) in the naive mice. Each circle and vertical bar represent the mean ± SEM. The asterisks indicate a statistically significant difference from saline group (**p < 0.01; ***p < 0.001). The daggers indicate a statistically significant difference between low NS and low NS with S-ketamine (S) (††p < 0.01). B, Effects of the intrathecal administration of saline or ChTX (4.3 ng) on the development of tactile allodynia after nerve injury. Each circle and vertical bar represent the mean ± SEM. The asterisks indicate a statistically significant difference from saline (ipsi) (*p < 0.05; ***p < 0.001). C–F, CLSM images for Iba1-positive spinal microglia in the L4 spinal cord at 3 d after intrathecal treatment with saline (C), low NS (D), combination of low NS and S-ketamine (S) (E), and high NS (F) in the normal mice. Scale bar, 50 μm. The small insets indicate higher magnification images of spinal microglia. Scale bar, 10 μm. G, The mean number of Iba1-positive microglia in the dorsal horn of the intrathecal administration of saline, low NS1619, a combination of low and S-ketamine (S), high NS. Each column and vertical bar represent the mean ± SEM of three independent experiments. The asterisks indicate a statistically significant difference between the values (***p < 0.001). H–K, CLSM images for Iba1-positive spinal microglia in the spinal dorsal horn at 3 d after treatment with intrathecal administration of saline (H, I) or ChTX (J, K) in the mice subjected to nerve injury. L, The effects of the intrathecal administration of ChTX on the mean number of Iba1-positive microglia in the contralateral (c) and ipsilateral (i) spinal dorsal horn of the mice subjected to nerve injury. Each column and vertical bar represent the mean ± SEM of three independent experiments. The asterisks indicate a statistically significant difference between the values (**p < 0.001).