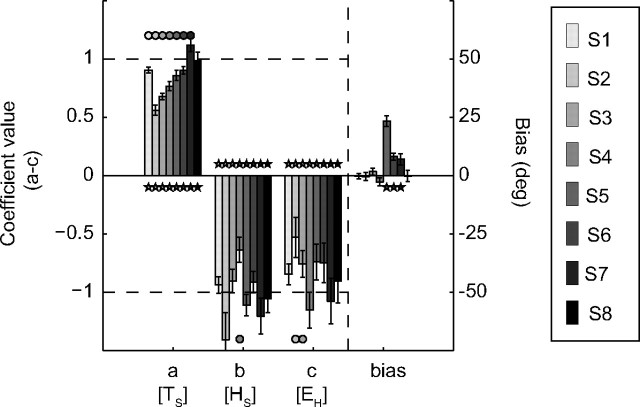
Figure 5.
Results of MLR (Eq. 5) for all listeners (gray-coded) to broadband stimuli in elevation for different static initial eye and head orientations. Data from all recording sessions were pooled. Response bias for each subject is indicated at the right side. Note the different scales. Error bars correspond to one standard deviation. Dashed lines at +1 and −1 denote ideal target representation and full compensation of eye and head positions, respectively.

