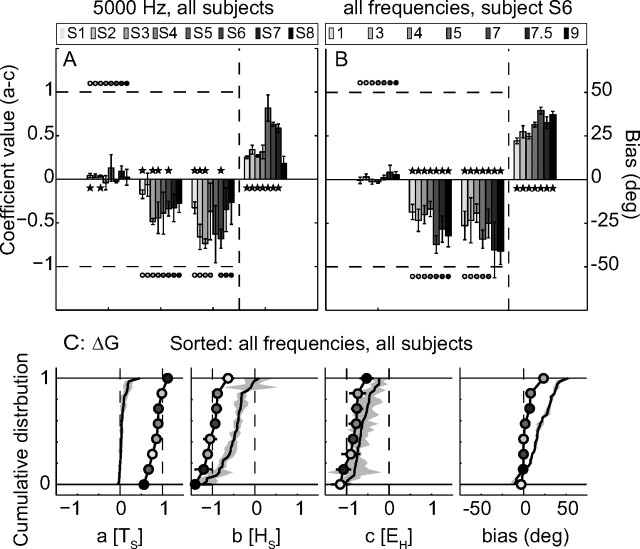
Figure 6.
A, MLR results for 5 kHz tone-evoked responses of all listeners (gray-coded). B, MLR results for the responses of listener S6 to all tones. C, Regression coefficients of the gaze shifts for all subjects to broadband noise (black lines and circles) and all tones (black lines and gray patch), presented as cumulative distributions.

