
Figure 6.
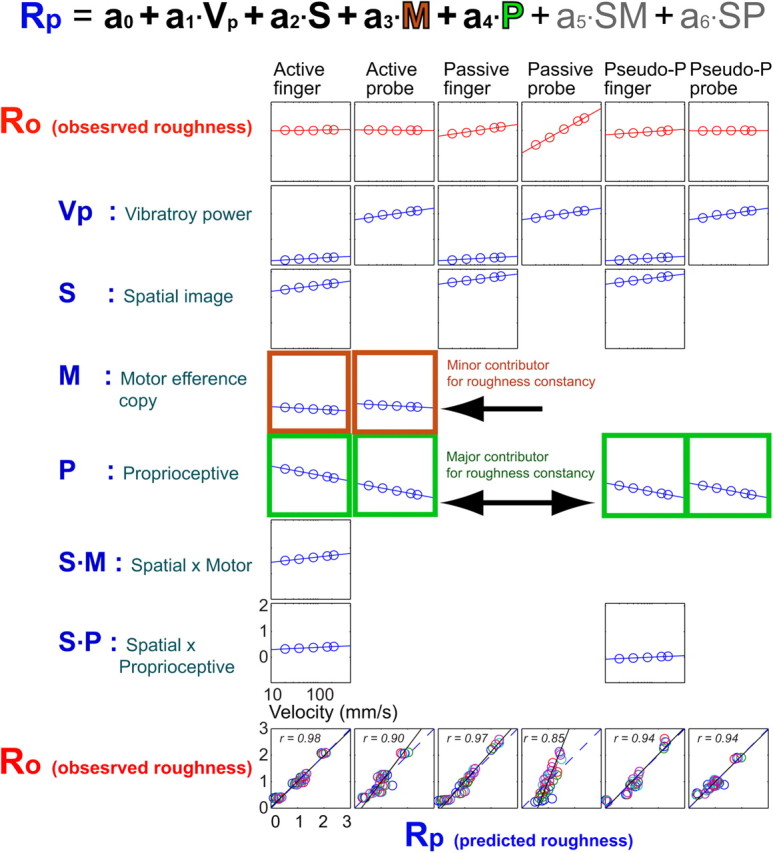
Relationship between the predicted perceived roughness and observed perceived roughness based on the generalized linear models with the contributions from velocity-linked vibratory power (Vp), spatial image (S), motor (M), proprioception (P), and their interactive terms (S · M and S · P). Proprioceptive inputs contribute more to roughness constancy than the motor efference copy does by reducing the velocity effect (i.e., increasing vibratory power by increasing velocities). Where the contribution of a particular component (Vp, S, M, P, or any interactive term) is not significant, no plot is shown. Perceived roughness is shown on the ordinate, and the log of scanning velocity (20, 40, 80, 160, 220 mm/s) is represented on the abscissa for the top seven rows. The data for six scanning conditions are shown: active finger, active probe, passive finger, passive probe, pseudo-passive finger, and pseudo-passive probe. The observed roughness ratings (Ro) are the average over seven texture stimuli for five velocities in each scanning condition. The predicted roughness ratings (Rp) are the sum of the contributions from Vp, S, M, P, and interactive terms S · M and S · P. Bottom, Correlations between observed (Ro) and predicted (Rp) roughness ratings for seven textures and five velocities in each scanning condition.