
Figure 1.
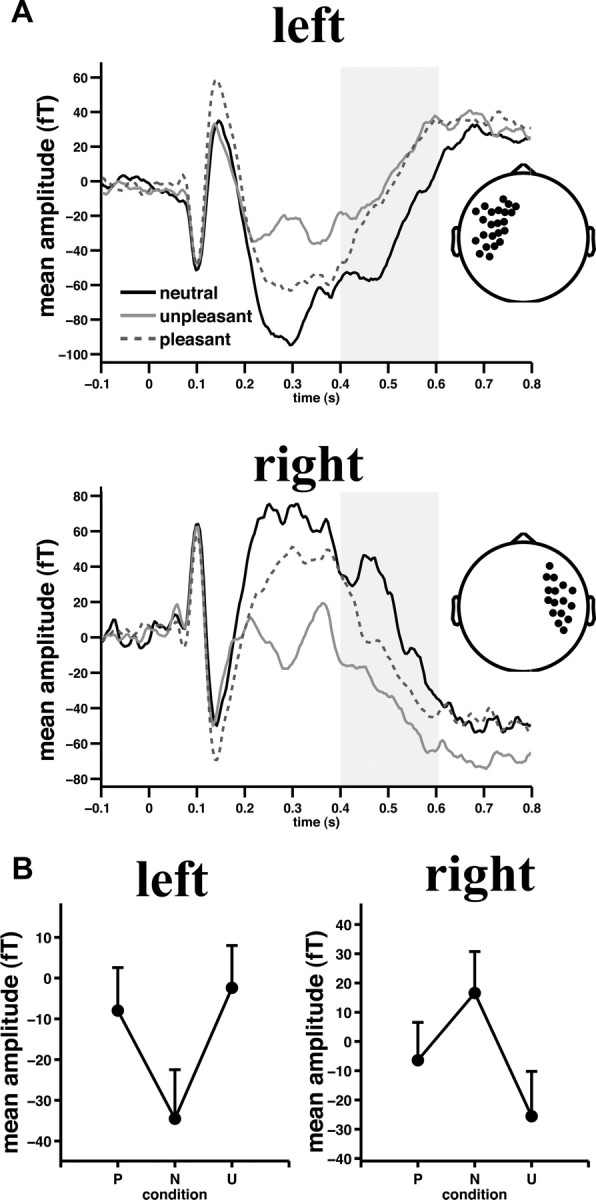
Significant emotional arousal modulation of sensor-level activity. A, Grand mean ERF waveforms across left (top) and right (bottom) temporal sensors as detected by permutation statistics between 0.4 and 0.6 s (gray shaded area). Insets depict sensor cluster locations. Note that differences between 0.2 and 0.4 s most likely reflect the magnetic counterpart of the early posterior negativity also present in the temporal sensor clusters due to volume conduction. B, Grand mean ERF amplitude across temporal sensors and the time interval of interest are shown. Positive versus negative values are due to reversed field directions. Pattern reversal of magnetic flux directions is due to different underlying cortical source orientations. Error bars, here and in subsequent figures, indicate SEM. P, Pleasant; N, neutral; U, unpleasant.