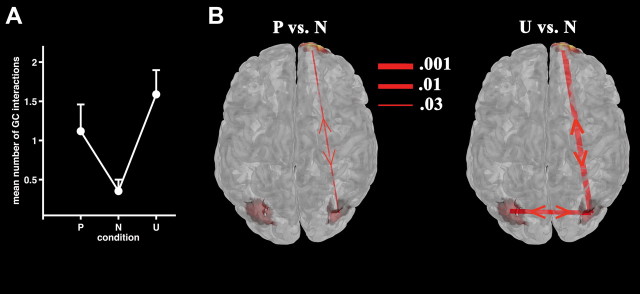
Figure 3.
Granger causality modeling of the mLPP network. A, Mean overall number of bidirectional GC interactions for each picture category averaged across 17 participants. B, Significant differences in proportions of bidirectional GC interactions between pleasant (P) (left) and unpleasant (U) versus neutral (N) (right panel) stimuli are illustrated, superimposed on a top view of the statistical map taken from Figure 2B. Line thickness indicates the significance level on McNemar testing.

