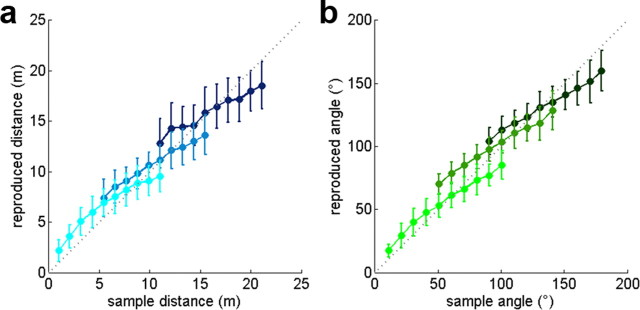
Figure 3.
Mean displacement estimation behavior over all participants for the three prior experience conditions (small displacements, intermediate displacements, and large displacements range). a, Mean participants' response in DE sessions in virtual meters (blues). b, Mean participants' response in AE sessions in degrees (greens). Error bars depict the standard deviation between participants' responses. The dotted line indicates were the response and sample stimulus would be equal. In both experiments, the behavior deviated significantly from the line of equality depending on the prior experience condition. Small displacements were underestimated and large displacements were overestimated in all conditions. The bias increased for increasing sample range, being strongest for the large displacements range (dark colors). Small displacements, intermediate displacements, and large displacements range, for DE: turquoise, light blue, and dark blue, respectively; for AE: bright green, olive, dark green, respectively.

