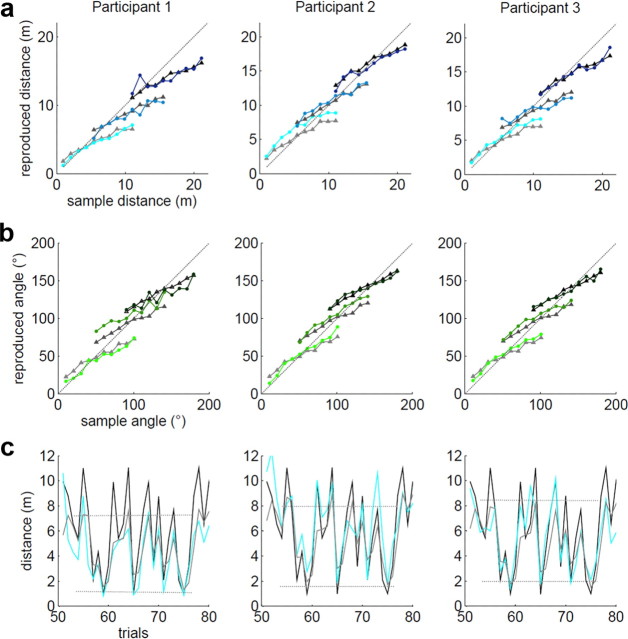
Figure 6.
Comparison of individual participants' responses with predicted behavior of the two-stage model. a, Mean responses of three selected participants in DE sessions and model predictions (gray triangles, wprior,Participant1 = 0.39, wprior,Participant2 = 0.39, wprior,Participant3 = 0.40). b, Mean responses of the same participants in AE sessions and model predictions (gray triangles, wprior,Participant1 = 0.15, wprior,Participant2 = 0.36, wprior,Participant3 = 0.38). c, Example of a typical time course for the same participants of sample displacements (black line), reproduced displacements (light blue line), and predicted displacements (gray line) within 30 trials of one DE session (small displacements range, trials: 50–80). Dotted lines indicate the range of displacements covered by the prediction of the model. Small displacements, intermediate displacements, and large displacements range, for DE: turquoise, light blue, and dark blue, respectively; for AE: bright green, olive, dark green, respectively.

