Figure 4.

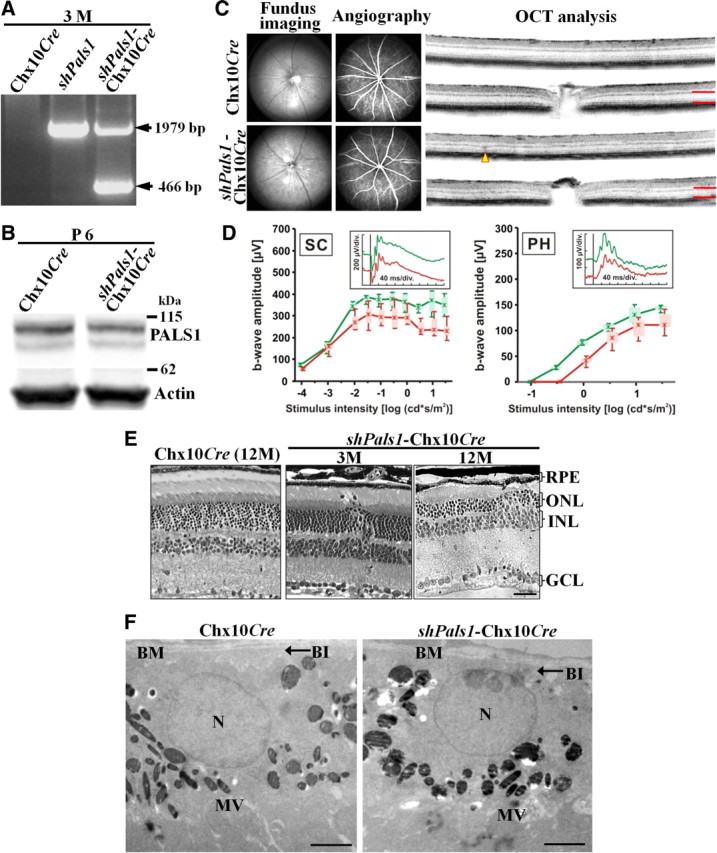
Decreased levels of PALS1 in shPals1-Chx10Cre retinas caused late onset of loss of vision. A, Genotyping of the mice (Chx10Cre, shPals1, and shPals1-Chx10Cre) was done on genomic DNA isolated from 3-month-old retinas. The lower bands (466 bp) are from shPals1-Chx10Cre recombined DNA products. B, PALS1 protein levels were decreased to 66 ± 4% in P6 shPals1-Chx10Cre retinas. PALS1 antibody was used to detect PALS1 protein in the retinas and actin antibody was used for loading control. Expression levels were normalized to actin. C, cSLO and OCT analysis of 12-month-old shPals1-Chx10Cre retinas. shPals1-Chx10Cre retinas showed almost normal fundus appearance and regular vascular pattern in cSLO fundus imaging but some mislocalized structures in the OPL are found with OCT imaging. Red lines indicate the thickness of the photoreceptor layer and arrowhead indicates folded ONL regions. D, Electroretinographic data from 12-month-old shPals1-Chx10Cre mutant mice and control Chx10Cre mice showing scotopic (SC, left) and photopic (PH, right) b-wave amplitudes from controls (green) and shPals1-Chx10Cre mice (red) as a function of the logarithm of the flash intensity. Boxes indicate the 25% and 75% quantile range, whiskers indicate the 5% and 95% quantiles, and solid lines connect the medians of the data. Insets, Scotopic (left) and photopic (right) single-flash ERGs with 1.5 log cd · s/m2 intensity of a Chx10Cre control mouse (green traces) and a shPals1-Chx10Cre mouse (red traces). The 12-month-old shPals1-Chx10Cre mice showed only slightly reduced scotopic and photopic responses compared to the Chx10Cre littermate controls. E, Morphological analysis of control Chx10Cre and shPals1-Chx10Cre retinas. At 3 months of age (3M), the shPals1-Chx10Cre retinas showed mild and sporadic phenotype. At 12 months of age (12M), the mutant retinas showed disturbed ONL and INL layers and also reduced width of the OPL. Scale bar, 50 μm. F, EM analysis of shPals1-Chx10Cre at P10. The RPE of shPals1-Chx10Cre showed normal cell structure as Chx10Cre controls. N, RPE cell nucleus; Mv, microvilli; BM, Bruch's membrane; BI, basal infoldings. Scale bar, 5 μm.
