
Figure 10.
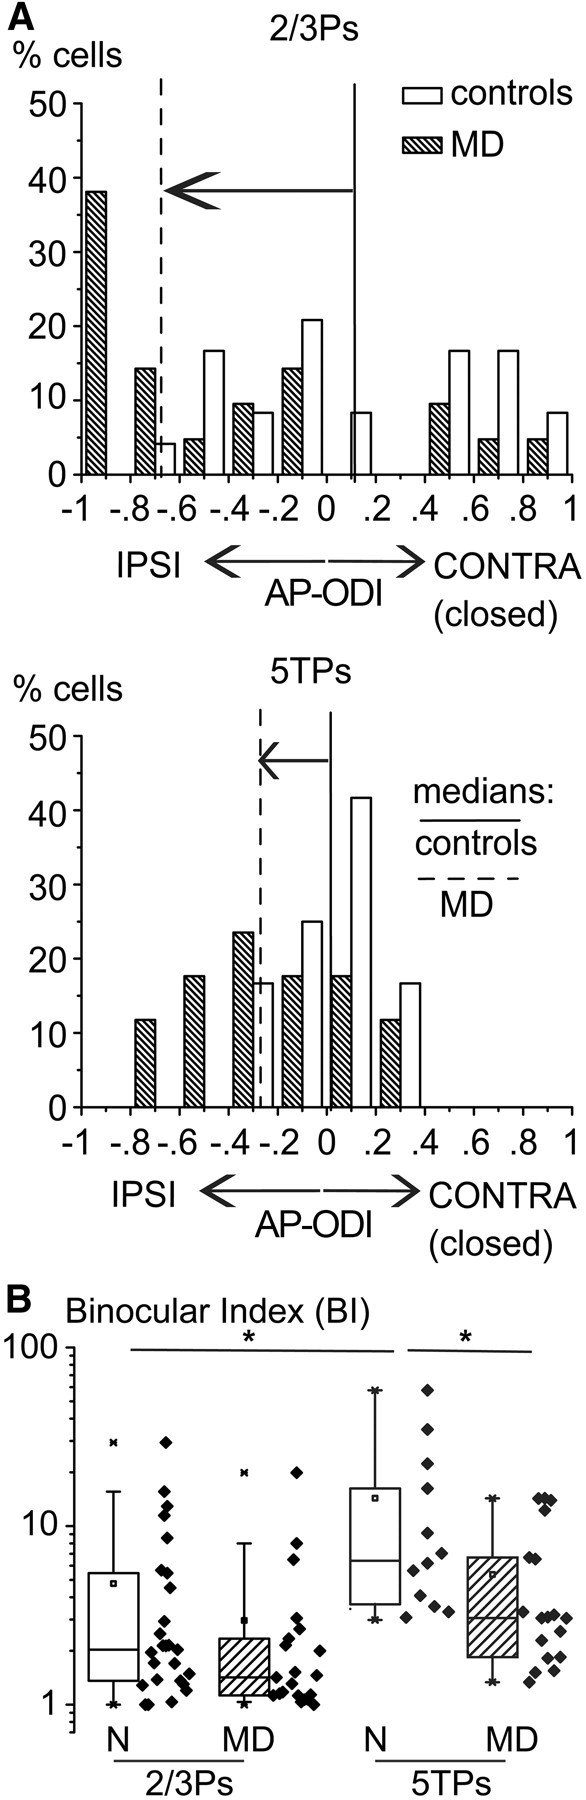
Differences in suprathreshold plasticity between 2/3Ps and 5TPs. A, MD caused an approximately twofold larger ocular preference shift of AP responses in 2/3Ps compared with 5TPs. Relative frequency distributions of AP-ODIs of 2/3Ps (top) and 5TPs (bottom) obtained from normal (N; black bars) and MD rats (dashed bars). The vertical lines are medians of ODIs for normal rats (continuous lines) and MD rats (dashed lines). Note that 5TPs had an ocular dominance distribution that is more centered around 0 (higher binocularity) but underwent a smaller ocular preference shift compared with 2/3Ps. B, Larger loss of binocularity of 5TPs compared with 2/3Ps after MD. Binocularity of single cells was computed as the absolute value of (C + I)/(C − I), where C and I are the amplitudes of AP responses to contralateral and ipsilateral eye stimulation, respectively. In normal rats, binocularity was larger for 5TPs compared with 2/3Ps (*p < 0.05). Loss of binocularity during MD was larger and significant only in 5TPs (p < 0.05) compared with 2/3Ps (p = 0.15). IPSI, Ipsilateral eye; CONTRA, contralateral eye.