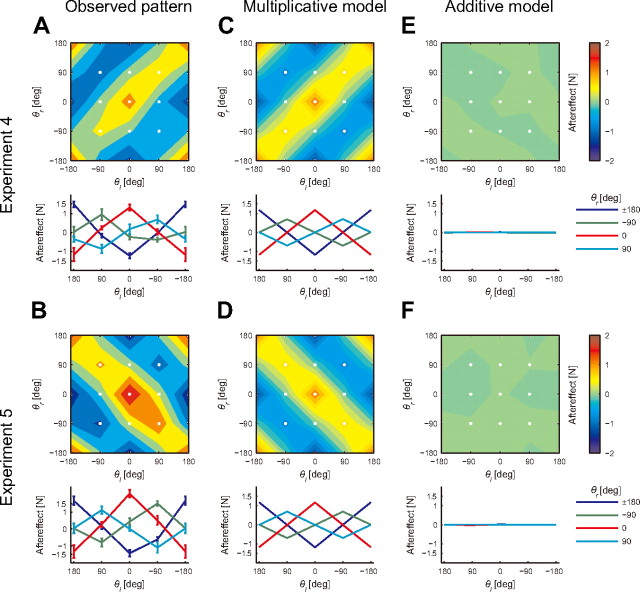
Figure 6.
Simultaneous adaptation to complicated force fields. A, B, The top panel shows the contour plot of the aftereffects for the trained left arm for Experiments 4 (A) and 5 (B). The white dots represent the training and tested movement configurations (4 movement directions for each arm). The bottom panel shows the relationship between the aftereffects and movement direction of the trained left arm for each movement direction of the untrained right arm (mean ± SE). C–F, The aftereffects predicted by the multiplicative (C, D) and additive models (E, F).

