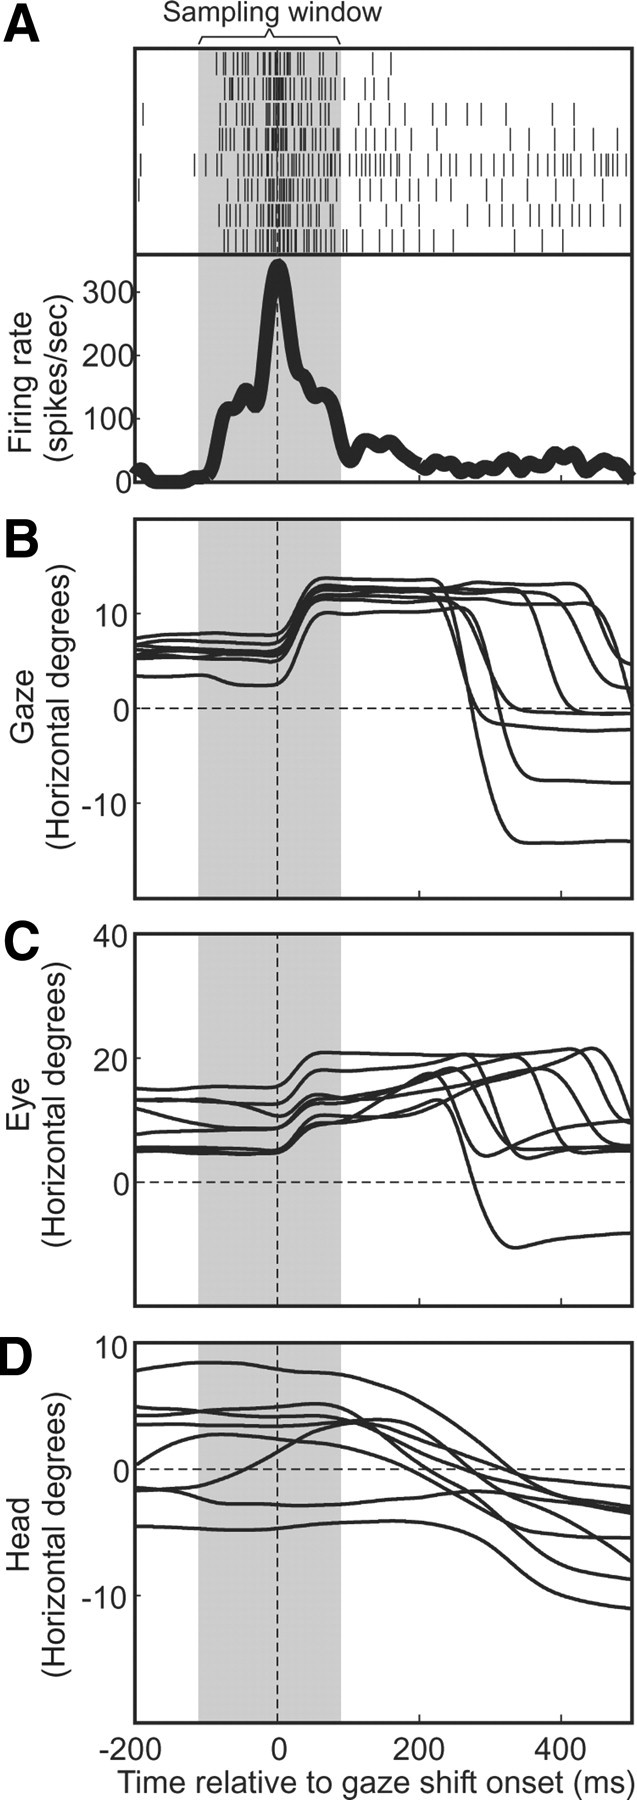
Figure 2.

Typical “gaze saccade burst” and associated horizontal gaze, eye, and head positions, plotted as a function of time. Data from all eight trials to the neuron's optimal hot spot are aligned with gaze shift onset. A, The perisaccadic neural activity is plotted for all correct (rewarded) trials made to a single secondary-target position, the rasters (black vertical bars) for each trial plotted on each line, the average firing rate across these trials plotted below as a thick black curve. The sampling window (duration in which spikes were included in firing rate for each of these trials) is indicated by the vertical gray band. B–D, Horizontal gaze (eye-in-space) evolutions across the perisaccadic interval are plotted for each trial (B), as are eye (eye-in-head) position (C) and head position (D). Times in these panels are aligned by gaze shift onset (vertical dashed line).
