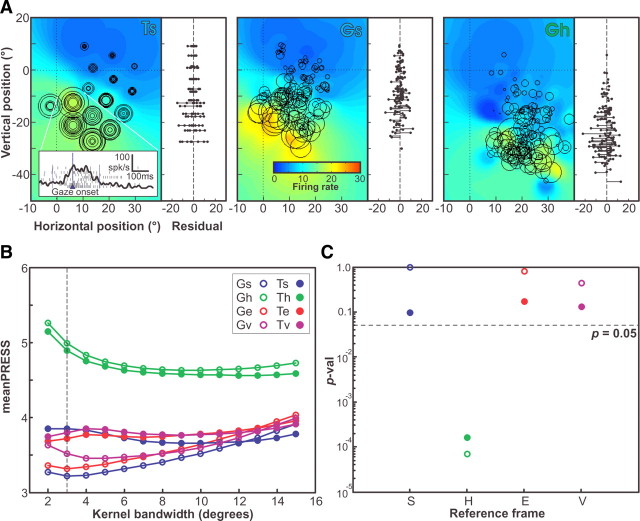
Figure 4.
Receptive field analysis—example neuron 2 (136 trials). A, The trial activities, represented as described in Figure 3, plotted in terms of target in space (laboratory) frame and in terms of Te, the representation of best fit. For each is shown the fitted receptive field obtained with the kernel bandwidth of best fit (2°), also as in Figure 3. Inset shows the rasters of all trials made to one saccade-target position, along with an integrated firing rate. Beside each receptive field is plotted the residual firing rates for all trials plotted as a function of vertical position in each representation. B, The mean PRESS values for fits obtained at kernel bandwidths of 2–15° in all eight representations (two positions × four reference frames), as in Figure 3. C, The p values of the Brown–Forsythe tests comparing the PRESS values of the representation of best fit with all eight representations.

