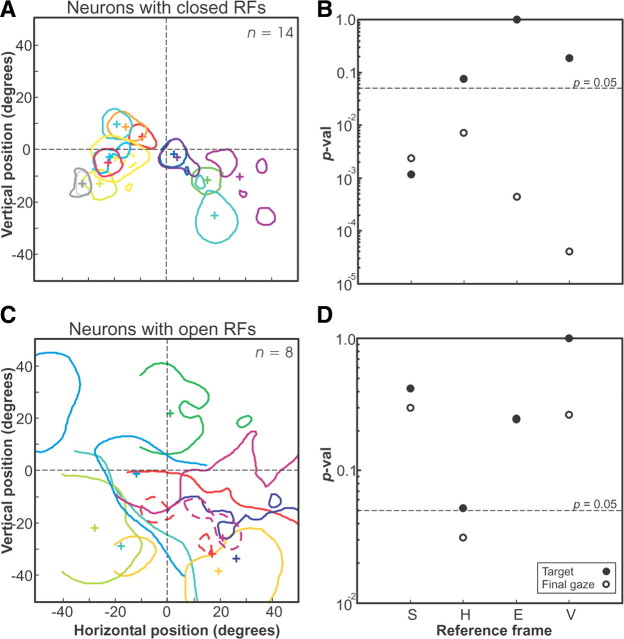
Figure 5.
Hot spots of neurons with closed and open receptive fields. A, Closed receptive-field neuron hot spots for fits of target position in eye frame, along with the center of mass of each hot spot (+). Here, hot spots were defined as regions of >50% of maximum fit firing rate. Only those neurons having a hot spot are plotted (22 of 32 neurons). B, p values comparing the best-fit frame (Te) with each other frame for the population of neurons from A. C, Open receptive-field neuron hot spots (“holes” in these hot spots are indicated by dashed lines). D, The p values comparing the best-fit frame (Tv) for the population of neurons from C.

