Figure 6.

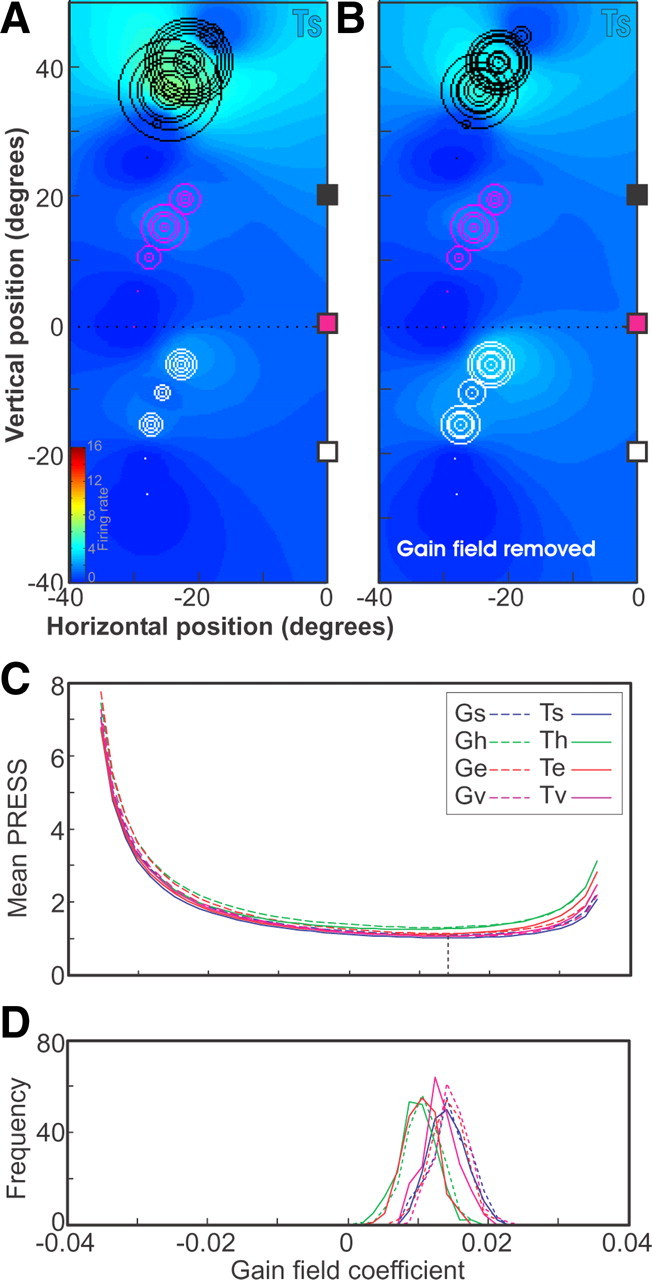
Gain-field statistics and removal. A, Mean PRESS values for the fits of G and T positions in s, h, e, and v frames for a range of linear gain-field coefficient values. The best-fit value, corresponding to the smallest mean PRESS, is indicated by the vertical dashed line. B, Histograms of best-fit linear gain-field coefficients for each position and reference frame for 200 random 80% subsets of trials. C, Fits of data plotted in terms of saccade-target position in Ts, where each trial is represented by a circle whose diameter is proportional to the number of spikes in the sampling window for the trial. Trials associated with the three different home-target positions (colored □) are plotted in different colors. D, Fits of the data for target in space frame where the gain-field factors have been divided out from the activity of each trial.
