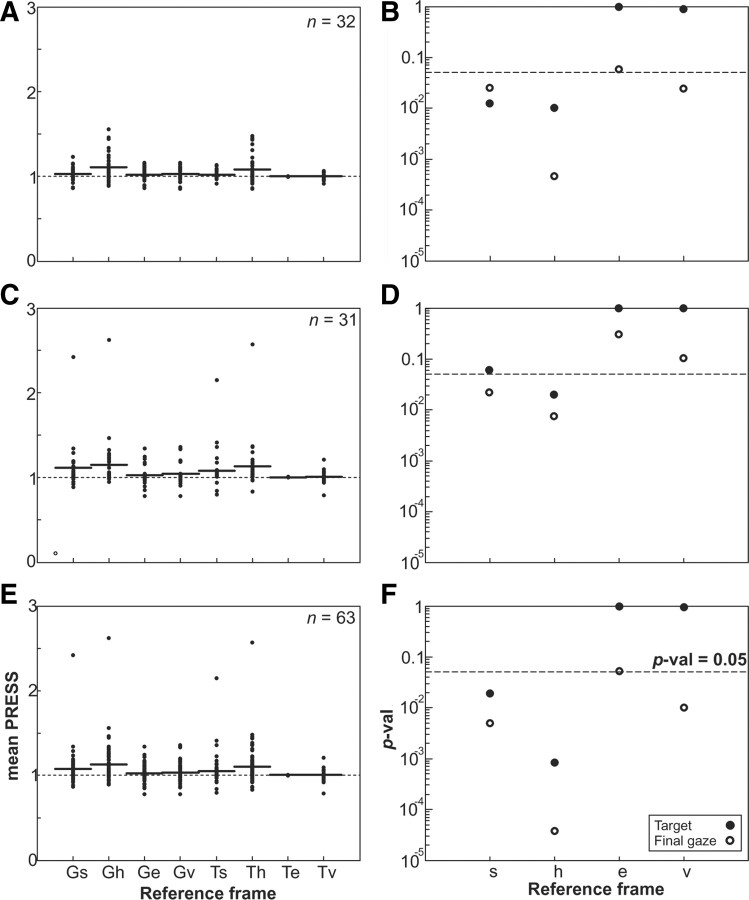
Figure 8.
Neuron population RMS PRESS and p values for neuron populations in different representations. A, C, E, RMS PRESS values are shown for all 8 representations (G and T × s, h, e, and v frames), normalized relative to target-in-eye representation values for 32 neurons whose receptive fields were mapped (A), 31 neurons with three widely spaced home-target positions (C), and the combined population of 63 neurons (E). For the neurons with three widely spaced home-target positions, the replacement PRESS values were used for space and head frames, described in the Materials and Methods and Appendix (supplemental material). B, D, F, The p values of a two-tailed t test comparing the PRESS residuals in each frame relative to the best-fit frame, which was target in eye frame are plotted for the receptive field-mapped neurons (B), the three home-target position neurons (D), and the combined population neurons (F).

