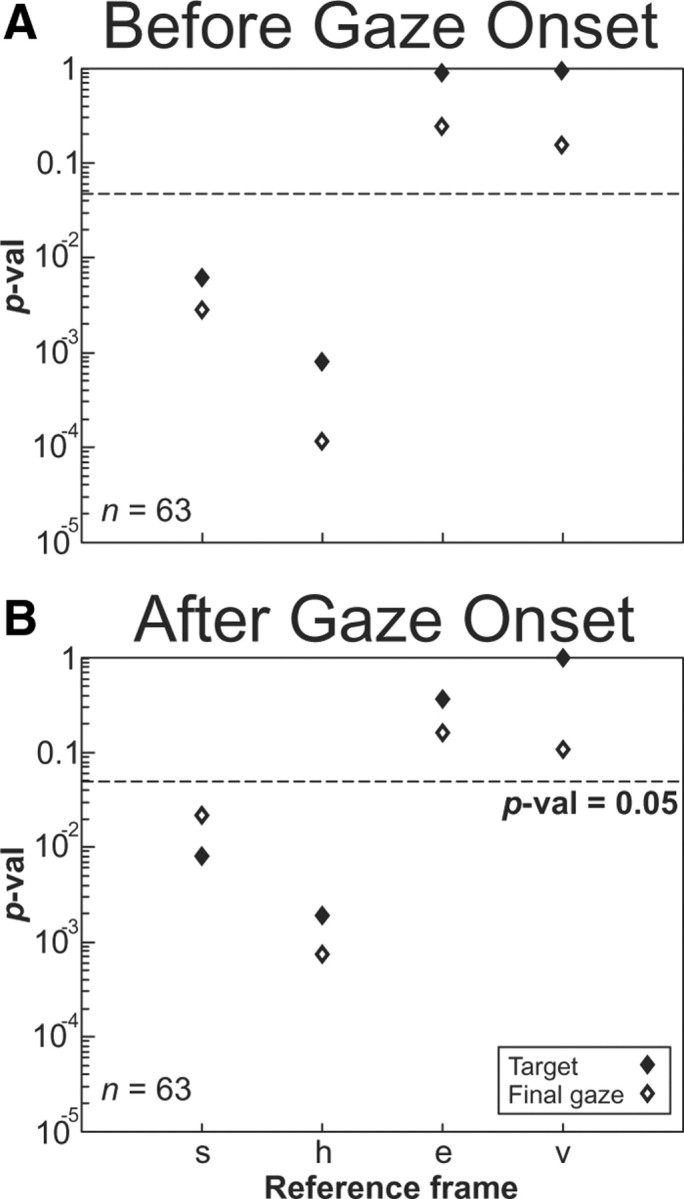
Figure 9.

A, B, Analysis of full population of neurons showing two time windows of before gaze onset (A) and after gaze onset (B) with p values in each reference frame representations. The p values of a two-tailed t test comparing the PRESS residuals in each frame relative to the best-fit frame for the entire population of neurons before gaze onset (A) and after gaze onset (B). All conventions are the same as in Figure 8 except that the diamond symbols illustrate that the data were separated aligned either before or after gaze onset for target (closed symbols) and final gaze position (open symbols).
