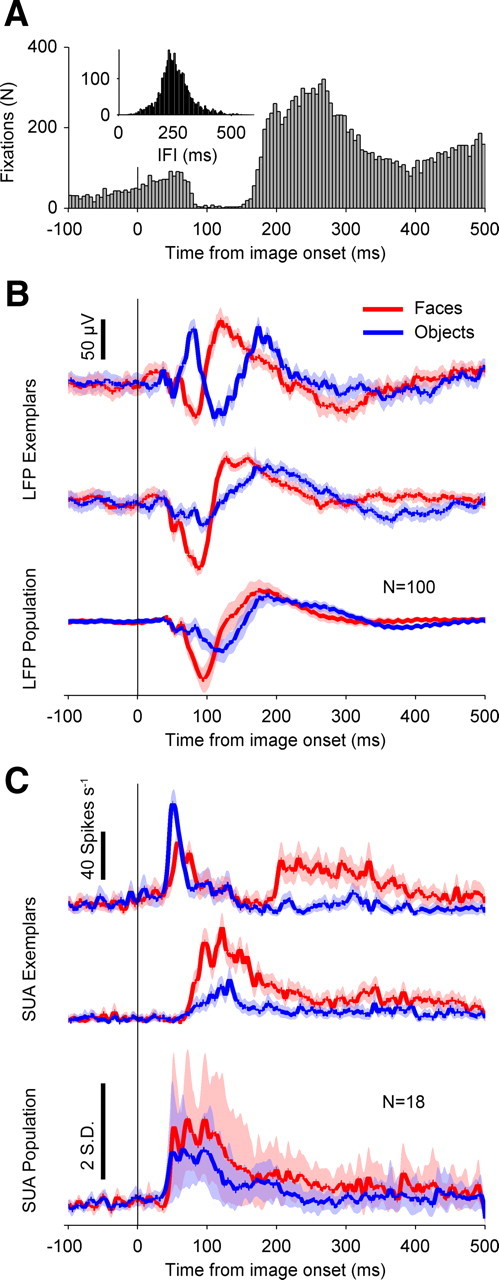
Figure 1.

Fixation timing and neural category selectivity. A, Distribution of fixation times relative to image onset, for both monkeys, across all sessions. Bin width is 5 ms. The y-axis is bin count, in number of fixations. For all figures, the vertical solid black line at time 0 indicates image onset, and the x-axis is time relative to image onset, in milliseconds. B, Category-selective LFP responses. The y-axis represents average voltage, in microvolts. The vertical black bar denotes 50 μV. The red traces are mean responses to faces, and the blue traces are mean responses to objects. The top and middle trace pairs are example trial-averaged responses from two electrode sites from the same recording session. The bottom trace is the population average, across both monkeys (N = 100 electrodes). Positive deflections indicate positive voltage polarity. The shaded regions indicate 95% confidence intervals, estimated by bootstrapping (10,000 samples). C, Category-selective SUA activity. The red traces are mean responses to faces, and the blue traces are mean responses to objects. The top and middle trace pairs are example trial-averaged responses from different sessions. For the top two pairs of traces, the y-axis depicts firing rate, in hertz. The top vertical black bar denotes 40 spikes per second. The bottom trace is the population average, across both monkeys (N = 18 visually responsive neurons). For the bottom population trace, the y-axis depicts mean Z-scored firing rates (−100 to 0 ms relative to image onset). The bottom vertical black bar denotes 2 SDs. The shaded regions indicate 95% confidence intervals, estimated by bootstrapping (10,000 samples).
