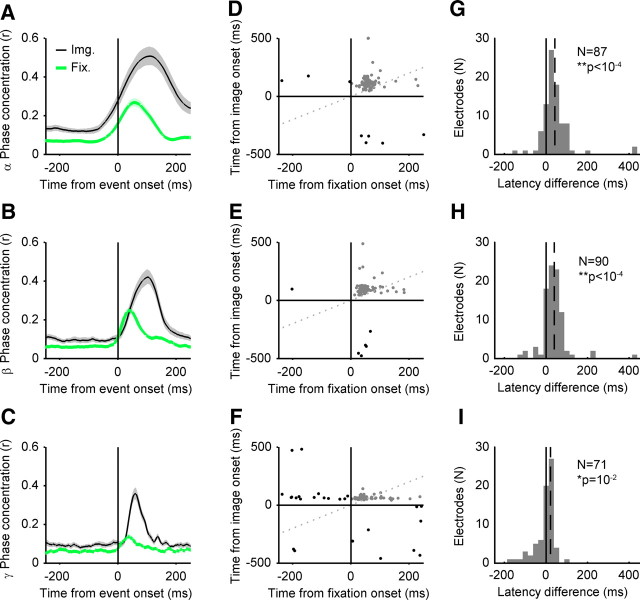
Figure 3.
Phase concentration aligned to image onset and fixation onset. A, The black traces depict the population average phase concentration in the alpha band (8–14 Hz), aligned to image onset. The green traces depict the population-average phase concentration of the residual activity aligned to fixation onset. The x-axis shows time from event (fixation or image onset). The y-axis depicts the magnitude of average phase concentration (Rayleigh's r statistic). The shaded regions represent 95% confidence intervals for the population mean, estimated by bootstrapping (10,000 samples). B, As in A, but for the beta band (14–30 Hz). C, As in A, but for the gamma band (30–60 Hz). D, Scatterplot of latency-to-peak phase concentration, for image-locked activity and fixation-locked residual activity in the alpha (8–14 Hz) band at each electrode site. The x-axis depicts time from image onset, and the y-axis depicts time from image onset. The vertical and horizontal axes depict the time of fixation/image onset, respectively. The oblique dotted gray line represents the line of equality (equal latency for both reference frames). Each dot represents latency from a single electrode site. Electrode sites showing postevent peaks in both reference frames are shown in gray and are included in the latency comparison analysis (G–I). Electrodes showing preevent peaks in either reference frame are shown in black and are not included in the latency comparison analysis (G–I). E, As D, but for the beta (14–30 Hz) band. F, As D, but for the gamma (30–60 Hz) band. G, Histogram of differences between image-evoked and fixation-evoked peak phase concentration in the alpha (8–14 Hz) band, for electrodes showing both postfixation onset and postimage onset peak latencies (G–I, gray dots in top right quadrant). The x-axis depicts peak latency differences (image onset minus fixation onset latencies). The negative values indicate shorter latency peak responses in the image-locked reference frame, and the positive values indicate shorter latency peak responses in the fixation-locked reference frame. Histogram bin sizes are 25 ms. The y-axis depicts frequency of occurrence, in number of electrode sites. The solid black vertical line depicts no difference in peak latency. The dashed black line represents the median peak latency difference of the distribution. The insets are the number of electrodes included in the analysis (N) and the p value from a paired Wilcoxon sign-rank test on latency values. H, As G, but for the beta (14–30 Hz) band. I, As G, but for the gamma (30–60 Hz) band.

