Figure 1.

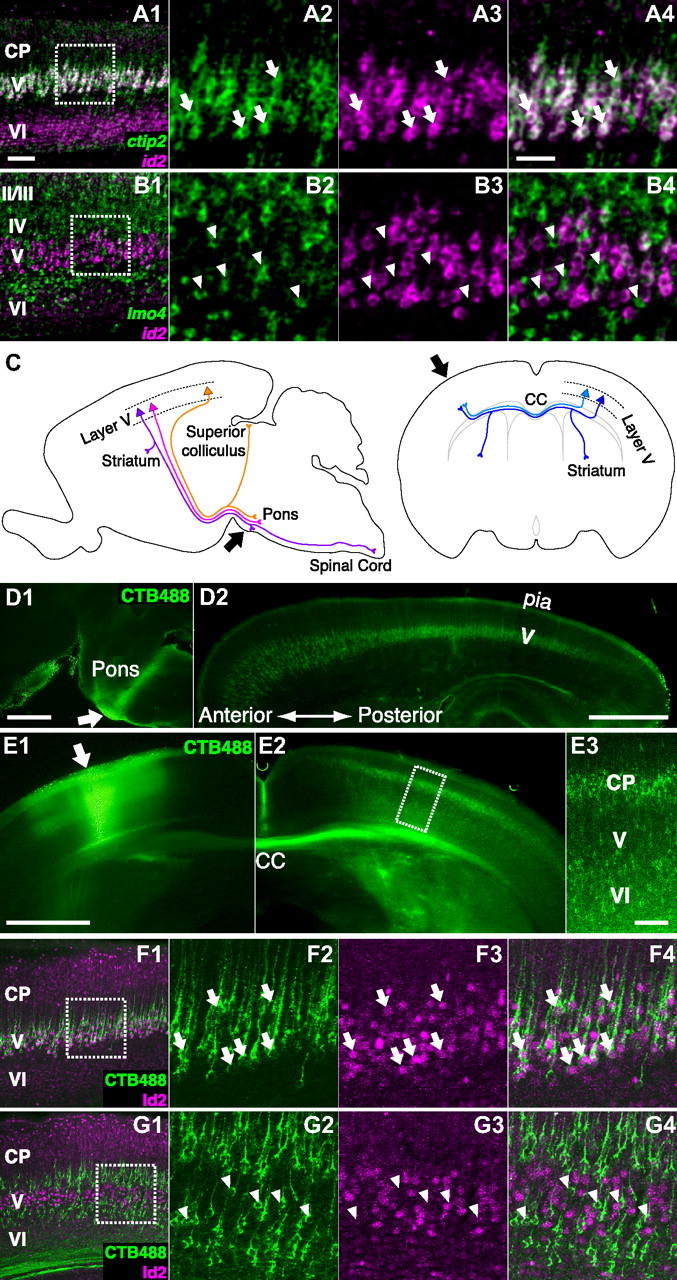
Cell type analysis in the visual cortex in young mice. A, Sagittal slice of the primary visual cortex (V1) at P4 showing id2 (magenta) and ctip2 (green) mRNAs labeled by FISH. A1, Low-magnification photograph. A2–A4, High-magnification photograph of the boxed region in A1 showing ctip2 mRNA (A2), id2 mRNA (A3), and both (A4). Arrows indicate cells expressing both id2 mRNA and ctip2 mRNAs. Thickness of the slice was 30 μm. Scale bars: (in A1) A1, B1, F1, and G1, 100 μm; (in A4) other panels in A, B, F, and G, 50 μm. B, Sagittal slice of V1 at P7 showing id2 (magenta) and lmo4 (green) mRNAs labeled by FISH. B1, Low-magnification photograph. B2–B4, High-magnification photograph of the boxed region in B1 showing lmo4 mRNA (B2), id2 mRNA (B3), and both (B4). Arrowheads indicate cells expressing lmo4 mRNA but not id2 mRNA. In layer VI, the signal of id2 mRNA (magenta in B1) is less prominent compared with that at P4 (magenta in A1). Thickness of the slice was 30 μm. C, Schematic illustration of retrograde labeling of pyramidal neurons in layer V. Left, Three subcerebral projection neuron subtypes, corticotectal neurons (orange), corticospinal motor neurons (purple), and corticopontine neurons (magenta), are shown. Right, Callosal projection neurons. Injection sites for retrograde labeling are shown by arrows. D, Retrograde labeling of subcerebral projection neurons. Sagittal slice of a P4 brain injected with CTB488 into the pons-midbrain junction at P2 showing CTB488 labeling. D1, Arrow indicates the injection site. D2, Retrogradely labeled subcerebral projection neurons. Thickness of the slice was 100 μm. Scale bars, 1000 μm. E, Retrograde labeling of callosal projection neurons. Coronal slice of a P4 brain injected with CTB488 into the contralateral cortex at P2 showing CTB488 labeling. E1, Arrow indicates the injection site. E2, Retrogradely labeled callosal projection neurons. E3, High-magnification photograph of the boxed region in E2. Thickness of the slice was 100 μm. Scale bars: (in E1) E1, E2, 1000 μm; in E3, 100 μm. F, Coronal slice of V1 at P4 showing Id2 protein (magenta) labeled by immunohistochemistry (IHC) and subcerebral projection neurons (green) retrogradely labeled by injecting CTB488 into the pons-midbrain junction at P2. F1, Low-magnification photograph. F2–F4, High-magnification photograph of the boxed region in F1 showing CTP488 labeling (F2), Id2 protein (F3), and both (F4). Arrows indicate subcerebral projection neurons expressing Id2 protein. In layer VI, the signal of Id2 protein (magenta in F1) is less prominent compared with that of id2 mRNA at P4 (magenta in A1). Thickness of the slice was 100 μm. G, Coronal slice of V1 at P4 showing Id2 protein (magenta) labeled by IHC and callosal projection neurons (green) retrogradely labeled by injecting CTB488 into the contralateral cortex at P2. G1, Low-magnification photograph. G2–G4, High-magnification photograph of the boxed region in G1 showing CTP488 labeling (G2), Id2 protein (G3), and both (G4). Arrowheads indicate callosal projection neurons without Id2 protein expression. In layer VI, the signal of Id2 protein (magenta in G1) is less prominent compared with that of id2 mRNA at P4 (magenta in A1). Thickness of the slice was 100 μm. CC, Corpus callosum; CP, cortical plate; Cortical layers are shown.
