Figure 10.

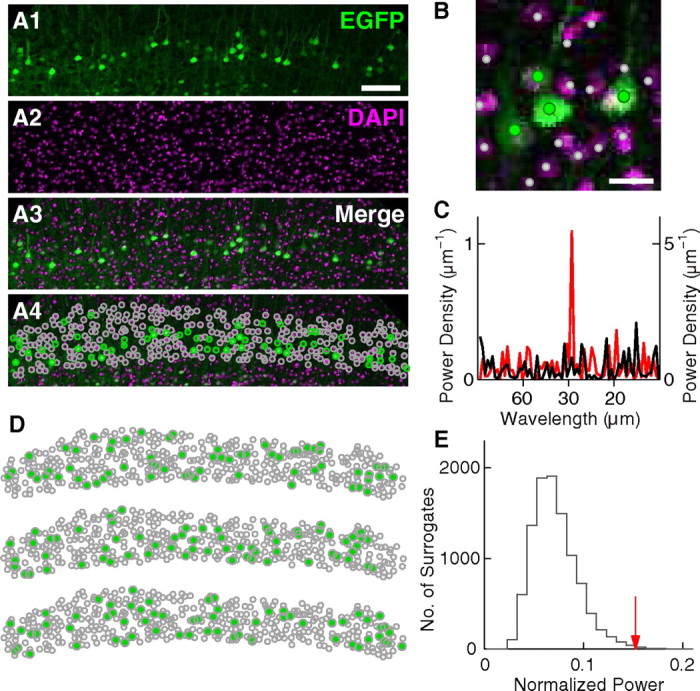
Periodicity analysis with all cell types in layer V. A, The same slice as shown in Figure 8C2. A coronal slice of the visual cortex of a P35 Crym-BAC-EGFP mouse showing EGFP protein labeled by immunohistochemistry (A1), DAPI staining of nuclei (A2), and both (A3 and A4). In A4, the positions of EGFP(+) and EGFP(−) nuclei in layer V are shown by green and gray open circles, respectively. Scale bar, 100 μm. B, High-magnification photograph of A4. Cells are marked similarly to A4, except that markers are solid circles. Scale bar, 20 μm. C, Red, Power spectrum of the cell position histogram of EGFP(+) cells in A4 prepared for the orientation of periodicity. The same graph as shown in Figure 8C4. The vertical axis is on the left. Black, Power spectrum of the positions of all cells, i.e., EGFP(+) cells and EGFP(−) nuclei in A4, measured in the same orientation as that used for the red curve. The vertical axis is on the right. D, Three surrogate datasets generated by randomly selecting surrogate EGFP(+) cells among all cells labeled in A4. The number of surrogate EGFP(+) cells was the same as that of the real EGFP(+) cells in A4. E, Red arrow, Normalized power calculated for EGFP(+) cells in the real data. Gray, Histogram of normalized power calculated for 10,000 surrogates generated as shown in D. Among the 10,000 surrogates, only 16 had normalized power larger than that of the real data.
