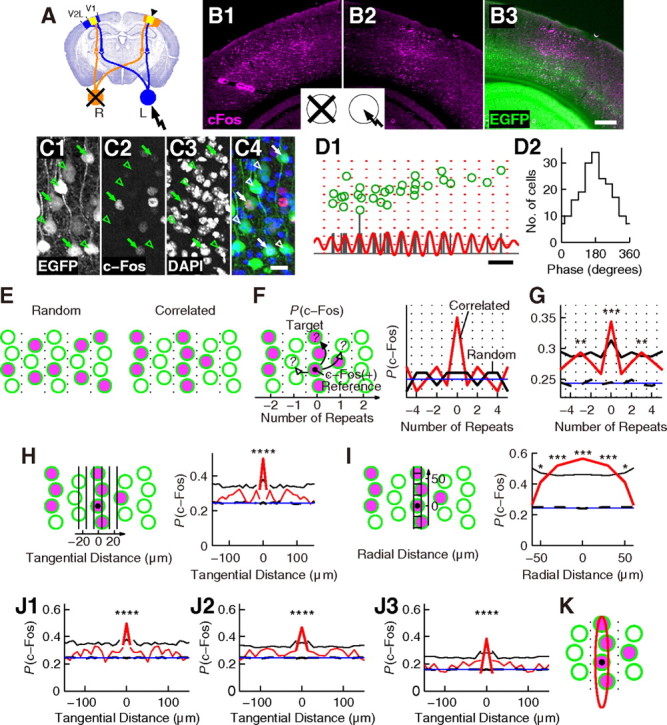
Figure 11.

Correlation analysis of c-Fos expression. A, Schematic representation of the mouse visual pathway as shown in Figure 7E on a coronal slice. B–C, c-Fos protein expression in the visual cortex of a P28 Crym-BAC-EGFP mouse induced by single-eye visual stimulation to the left eye. B, Low-magnification photographs showing c-Fos (magenta) and EGFP (green) proteins labeled by IHC. B1–B2, The right (B1) and left (B2) hemispheres are shown. Open and closed eyes are shown schematically as in A. Note the asymmetry of c-Fos expression between the two hemispheres. The area that showed c-Fos expression in B2 is the left binocular region. B3, The same slice as B2 simultaneously visualized for c-Fos and EGFP. Scale bar, 300 μm. C, High-magnification photographs of layer V in B3 showing EGFP (C1), c-Fos (C2), DAPI staining of nuclei (C3), and merged image (C4; green, EGFP; red, c-Fos; blue, DAPI). Arrows indicate EGFP(+)c-Fos(+) cells, and open arrowheads indicate EGFP(+)c-Fos(−) cells. Scale bar, 20 μm. D, Grouping cells into repeating units. D1, Green circles represent EGFP(+) cells in a part of the slice shown in Figure 8A2. The orientation of periodicity was set to be horizontal. The cell position histogram is shown in black. Red line is the bandpass filtered histogram (wavelength range = 27.5–30.5 μm). The vertical scale and the vertical position of the red line were adjusted to overlap the histogram. Red dotted lines represent the borders located at troughs of the red line. Scale bar, 50 μm. D2, Phase histogram of EGFP(+) cells in slices shown in Figure 8A2 and B2. E–J, Analysis of correlation in c-Fos expression. E, Schematic illustration of random (left) and correlated (right) c-Fos expression. Only EGFP(+) subcerebral projection neurons are shown. Green open circles are EGFP(+)c-Fos(−) cells, while green circles filled with magenta are EGFP(+)c-Fos(+) cells. Dotted lines are borders between repeating units. F, Left, Schematic illustration of the definition of P(c-Fos). Black dot denotes an EGFP(+)c-Fos(+) cell used as a reference cell. P(c-Fos) was calculated for target cells located within repeating units containing reference cells (arrow with solid arrowhead) or for target cells located within other repeating units such as those adjacent to repeating units containing reference cells (arrows with open arrowheads). Right, P(c-Fos) expected under random (black) or correlated (red) expression. Blue line denotes PRand. G, Red, P(c-Fos) calculated with data obtained from nine mice. **p < 0.01; ***p = 0.0001. Blue, PRand. Black solid and black dashed lines indicate the highest 1% and the median of P(c-Fos) calculated with surrogate data that have random c-Fos expression, respectively. H, Analysis at high spatial resolution. Left, Arrangement of bins to calculate P(c-Fos) at positions relative to reference EGFP(+)c-Fos(+) cells (black dot). Right, P(c-Fos) calculated for target cells located within repeating units containing reference cells (thick red line) and for target cells located within other repeating units (thin red line). ****p < 0.0001. Black solid and black dashed lines are results of surrogate data calculated separately for the two cases and shown as in G. Blue line denotes PRand. I, Analysis in the radial orientation. Left, Arrangement of bins. Black dot denotes a reference EGFP(+)c-Fos(+) cell. Right, Result obtained for target cells located within repeating units containing reference cells, shown as in G. *p < 0.05; ***p = 0.0002 and 0.0006 for the central and the adjacent bins, respectively. J, Robustness tests shown as in the right panel in H. J1–J2, The same analyses as shown in H was performed using bins with widths of 8.5 μm (J1) and 14 μm (J2). J3, The same analyses as shown in J2 was performed using 121 EGFP(+)c-Fos(+) cells that showed relatively strong c-Fos expression among the 173 EGFP(+)c-Fos(+) cells used in J2. K, Schematic illustration of the correlation at high resolution. Within a single repeating unit, c-Fos expression was correlated across approximately ±15 and ±60 μm in the tangential and radial orientations, respectively (red ellipse), relative to reference EGFP(+)c-Fos(+) cells (black dot).
