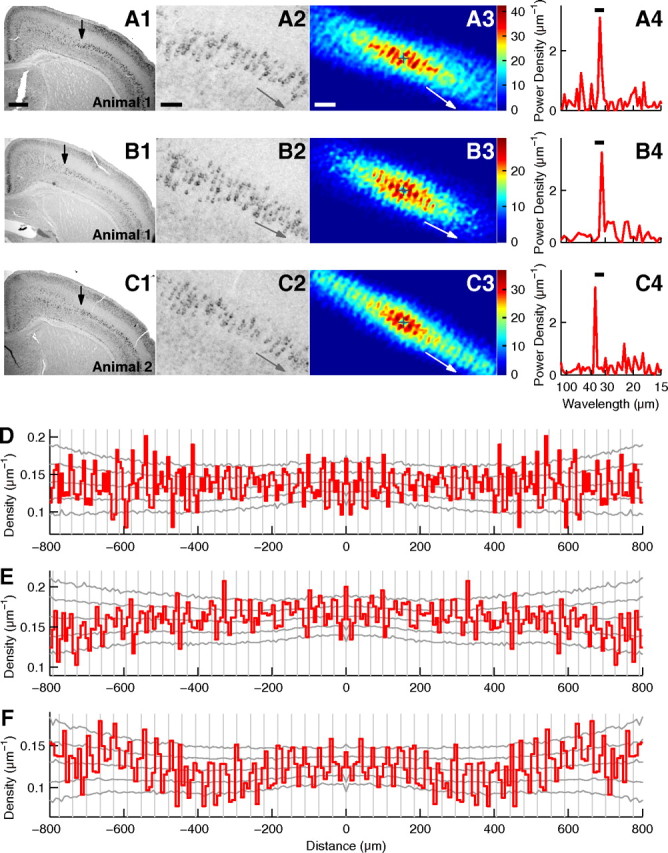
Figure 5.

Periodic arrangement of id2(+) cells in the somatosensory cortex. A, Analysis of a slice of the P9 somatosensory cortex stained for id2 mRNA with NBT/BCIP. A1, Low-magnification photograph. Arrow indicates the position from which strong id2 expression in layer V extended laterally. Approximately 1.1 mm layer V extending laterally from this arrow was used for periodicity analysis. Scale bar: (in A1) A1, B1, and C1, 500 μm. A2, High-magnification photograph of A1. Left edge is approximately at the same position as shown by the arrow in A1. Gray arrow denotes the orientation of periodicity. Scale bar: (in A2) A2, B2, and C2, 100 μm. A3, Histogram of relative positions smoothed with the Gaussian function (σ = 7 μm). The origin is shown by the plus sign and the number of cells is shown in color. White arrow denotes the orientation of periodicity. Scale bar: (in A3) A3, B3, and C3, 100 μm. A4, Power spectrum of the cell position histogram prepared for the orientation of periodicity. The peak wavelength = 33.3 μm. The bar indicates the wavelength range used for the significance test (30.0–35.0 μm). p = 0.0028. B, Analysis of another slice from the same mouse as used in A. σ = 7 μm in B3. The peak wavelength in B4 = 32.1 μm. The wavelength range in B4 is 30.0–35.0 μm. p = 0.0022. C, Analysis of a slice from another mouse. σ = 7 μm in C3. The peak wavelength in C4 = 36.7 μm. The wavelength range in C4 is 32.5–37.5 μm. p = 0.0011. D–F, Autocorrelograms of cell positions in A–C, respectively. Autocorrelograms were prepared for the orientation of periodicity. Gray vertical lines are placed every 32.2, 33.0, and 36.9 μm, respectively. Gray lateral lines show the highest 2.5%, the highest 15.9%, the median, the lowest 15.9%, and the lowest 2.5% of autocorrelograms calculated for random surrogates.
