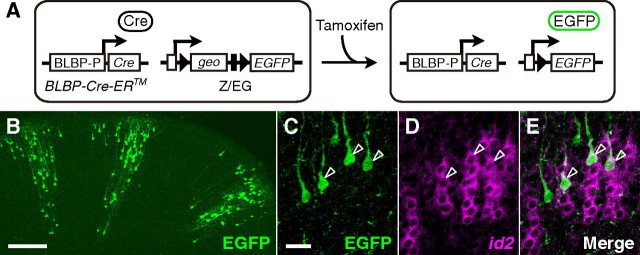
Figure 6.
Clonal analysis of id2(+) cells. A, Schematic illustration of EGFP induction by chromosomal excision in BLBP-Cre-ER; Z/EG embryos. A cortical progenitor cell before tamoxifen administration (left) and after chromosomal excision (right). The BLBP promoter (BLBP-P), Cre-ER (Cre) and its protein product, the pCAGGS promoter (open rectangle), the loxP sequence (triangle), βgeo (lacZ/neomycin-resistance), the SV40 polyadenylation sequence (solid rectangle), and EGFP and its protein product are shown. B, Three clusters of EGFP(+) cells observed in the transgenic mice administered with tamoxifen. The visual cortex of a P4 mouse. Scale bar, 200 μm. C–E, EGFP (C) and id2 mRNA expression (D) in the transgenic mice administered with tamoxifen. E, Merged image of C and D. Arrowheads indicate EGFP(+)id2(+) cells. The somatosensory cortex of a P4 mouse. Scale bar: (in C) C, D, and E, 30 μm.

