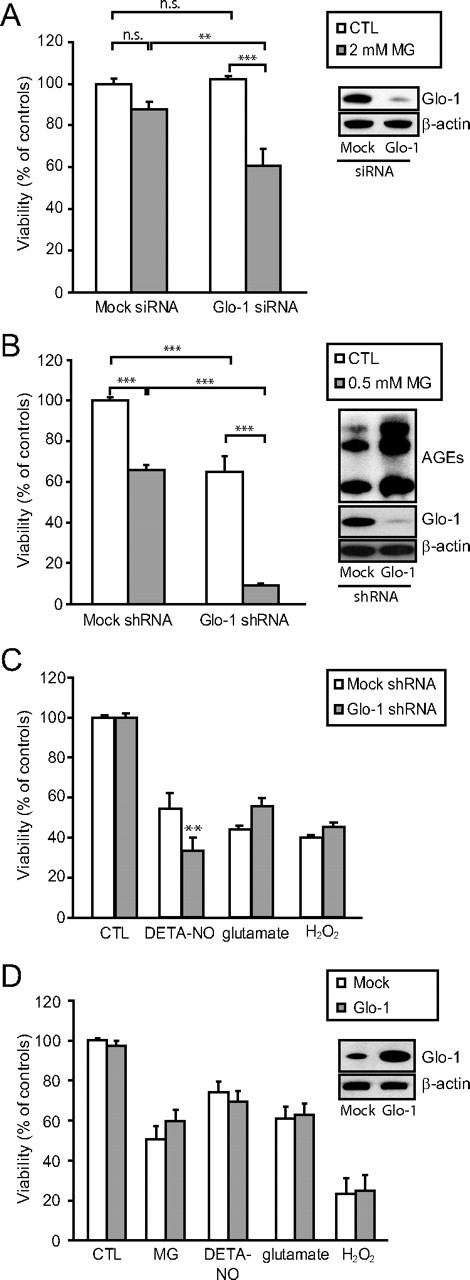
Figure 8.

Effects of RNA interference against Glo-1 in astrocytes and neurons. A, Astrocytes were transfected with siRNA against Glo-1 or negative control siRNA (mock siRNA). Representative Western blot bands demonstrating the resulting decrease in Glo-1 expression are shown. Cells were subsequently exposed to vehicle (white bars) or 2 mm MG (gray bars), and cellular viability was assessed 24 h later using the MTT viability assay. Results are expressed as a percentage of controls (CTL) and are means ± SEM of at least six determinations from at least two independent experiments. Data were statistically analyzed with two-way ANOVA followed by Tukey's multiple-comparisons test (n.s., not significantly different; **p ≤ 0.01; ***p ≤ 0.001). B, Glo-1-targeted shRNAs (or mock shRNAs) were delivered in neurons using lentiviral vectors. Representative Western blot bands demonstrating the resulting decrease in Glo-1 expression and increase in AGE levels are shown. Cells were subsequently exposed to vehicle (white bars) or 0.5 mm MG (gray bars) and cellular viability was assessed 24 h later. Results are expressed as a percentage of controls and are means ± SEM of six determinations from two independent experiments. Data were statistically analyzed with two-way ANOVA followed by Tukey's multiple-comparison test (***p ≤ 0.001). C, Glo-1-targeted shRNAs (gray bars) or mock shRNAs (white bars) were delivered in neurons using lentiviral vectors. Neurons were subsequently exposed to various cellular stresses (DETA-NO, 100 μm for 24 h; glutamate, 10 μm for 4 h; and H2O2, 25 μm for 4 h) before assessing cellular viability using the MTT assay. Results are expressed as a percentage of controls and are means ± SEM of at least six determinations from at least two independent experiments. Data were statistically analyzed with two-way ANOVA followed by Bonferroni's test (**p ≤ 0.01). D, Glo-1 (gray bars) or a mock construction (white bars) were delivered in neurons using lentiviral vectors. Neurons were subsequently exposed to various cellular stresses (MG, 500 μm for 24 h; DETA-NO, 100 μm for 24 h; glutamate, 10 μm for 4 h; and H2O2, 25 μm for 4 h) before assessing cellular viability using the MTT assay. Results are expressed as percentage of controls and are means ± SEM of at least nine determinations from at least three independent experiments. Data were statistically analyzed with two-way ANOVA followed by Bonferroni's test and no statistical differences could be found between mock and Glo-1 groups in any of the conditions.
