
Figure 2.
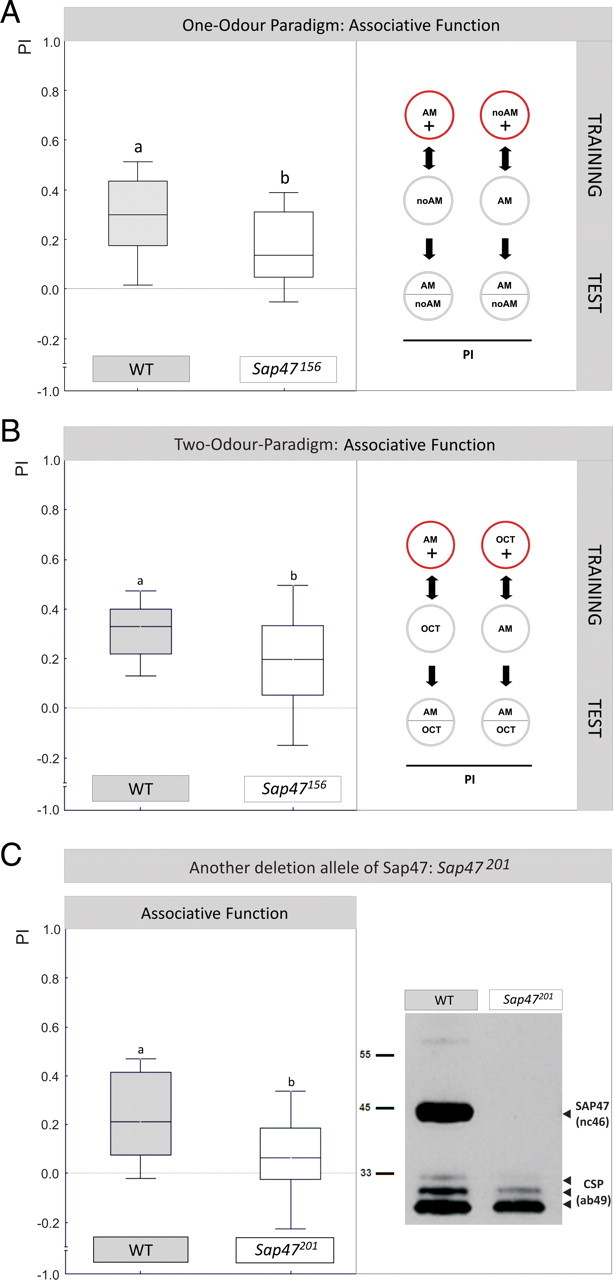
Associative function. A, Sap47156 mutants are impaired in associative function. WT and Sap47156 can learn, but performance indices in Sap47156 mutants are reduced by ∼50%. The inset illustrates the training regimen: For each genotype, one group is trained such that in the presence of amyl acetate animals are rewarded, whereas in the absence of amyl acetate they are not rewarded (AM+/noAM); the second group is trained reciprocally (AM/noAM+). Note that in half of the cases the sequence of trials is as indicated (i.e., the respective AM-containing trials first), but in the other half of the cases it is inverted; the sequence of training trials is without effect on test performance (supplemental Fig. 1, available at www.jneurosci.org as supplemental material). The PI measures the extent to which both reciprocally trained groups differ in their AM preference during the test, and thus provides a measure of associative learning; the PREF scores underlying all PI values are documented in supplemental Figure 2A (available at www.jneurosci.org as supplemental material). N = 35, 35. Different lettering above plots signifies p < 0.05 in a Mann–Whitney U test. Box plots represent the median as the middle line, 25 and 75% quantiles as box boundaries, and 10 and 90% quantiles as whiskers. B, Also in a differential, two-odor paradigm Sap47156 mutants are impaired in associative function. Performance indices of Sap47156 mutants are also reduced by ∼50% compared to WT in a differential, two-odor version of the learning paradigm. The inset illustrates the training regime. N = 35 in both cases (one-sample sign tests: p < 0.05/2 for both genotypes). Different lettering above plots signifies p < 0.05 (U = 414.5; sample sizes as above) in a Mann–Whitney U test. The PREF scores underlying all PI values are documented in supplemental Figure 2B (available at www.jneurosci.org as supplemental material). C, Another deletion allele of Sap47 is also impaired in associative function. Left, Performance indices in the one-odor paradigm in Sap47201 mutants are reduced by ∼50% compared to WT. N = 16, 14, respectively (one-sample sign test: p = 0.21 for Sap47201 and p < 0.05/2 for WT). Different lettering above plots signifies p < 0.05 (U = 61; sample sizes as above) in a Mann–Whitney U test. The PREF scores underlying all PI values are documented in supplemental Figure 2C (available at www.jneurosci.org as supplemental material). Right, No signal is detectable on a Western blot of the Sap47201 mutant, whereas WT shows the expected band at 47 kDa. Anti-SAP47: nc46; anti-CSP: ab49 (loading control).