
Figure 2.
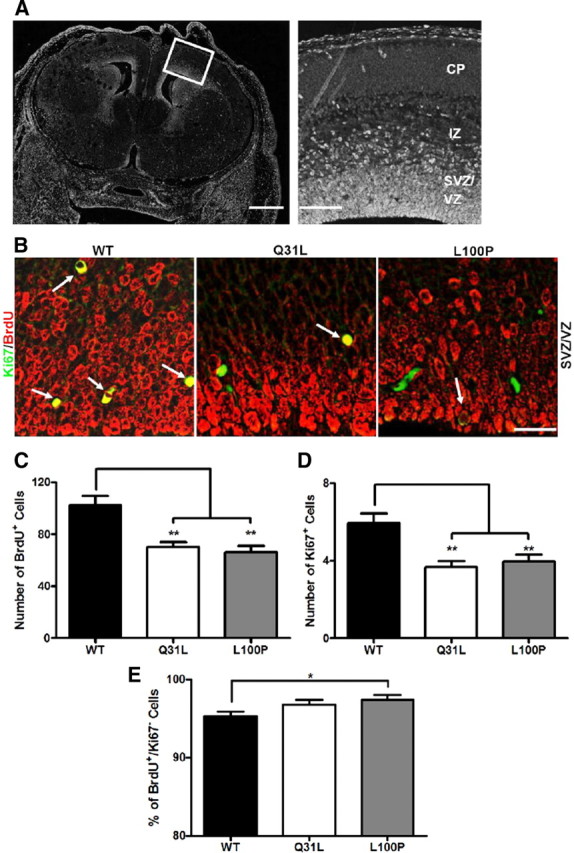
Decreased neuronal progenitor proliferation in Disc1 mutant mice. A, Coronal section of an E15 brain section with a higher magnification image of the different layers in the embryonic cortex (boxed area in the left image) shown in the right image. Scale bars, 250 μm (left) and 50 μm (right). BrdU was injected into pregnant dams at E14, and embryonic brains were collected at E15 for BrdU and Ki67 immunohistochemistry. CP, Cortical plate; IZ, intermediate zone. B, BrdU (red) and Ki67 (green) fluorescently labeled images of the SVZ/VZ region in WT, Q31L, and L100P mutants (left to right). White arrows indicate double-labeled (BrdU+ and Ki67+) cells. Scale bar, 30 μm. C, D, Quantification of BrdU+ (C) and Ki67+ (D) cells in a fixed ROI (100 μm × 120 μm) within the SVZ/VZ region revealed fewer BrdU- and Ki67-labeled cells in both Q31L and L100P mutants when compared to WT (n = 24; t test, p < 0.01). E, The cell cycle exit index is calculated as the fraction of cells labeled only with BrdU and no longer dividing (BrdU+ and Ki67−) divided by the total number of BrdU+ cells. Only a small significant increase in the percentage of BrdU+/Ki67− cells was observed with the L100P mutants, but not the Q31L mutants, when compared to WT. All data are presented as mean ± SEM; *p < 0.05, **p < 0.01 vs WT.