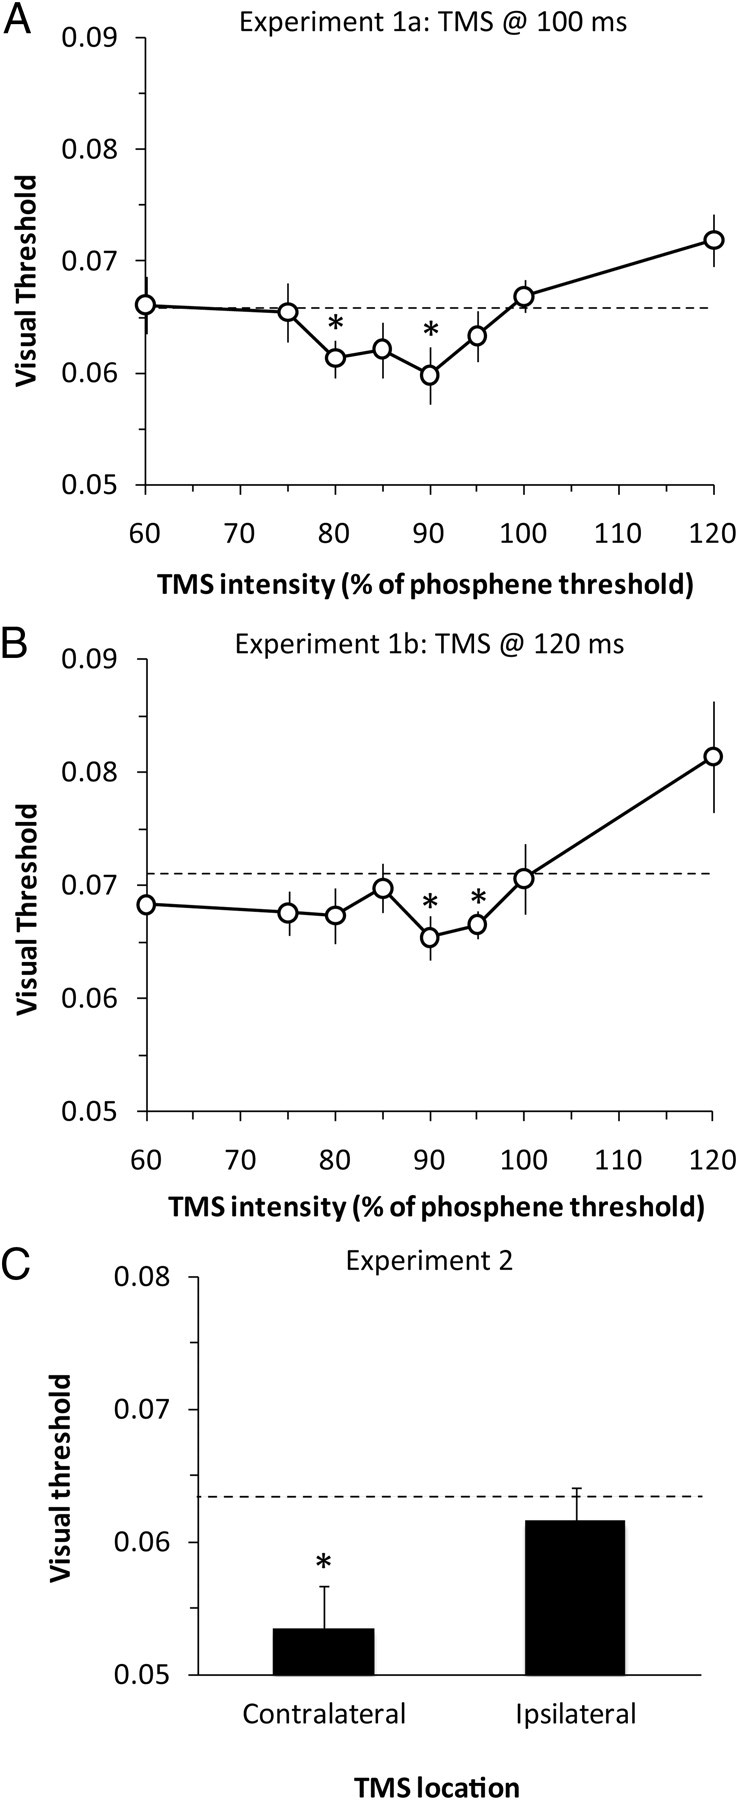
Figure 2.

A–C, Detection thresholds, relative to the Cz control condition (dashed black line), in experiments 1a (A), 1b (B), and 2 (C). Values below the dashed line indicate an improvement in visual sensitivity. In experiments 1a and 1b, a single pulse of TMS was delivered to visual cortex 100 or 120 ms after onset of the visual stimulus. The intensity of TMS varied from 60 to 120% of the phosphene threshold. Experiment 2 compared the effect of TMS applied to visual cortex contralateral or ipsilateral to the stimulus, 120 ms after stimulus onset at an intensity just below phosphene threshold. Error bars show within-subject SEM (for the difference with Cz), and asterisks identify thresholds that were significantly different from Cz (p < 0.05).
