Figure 1.
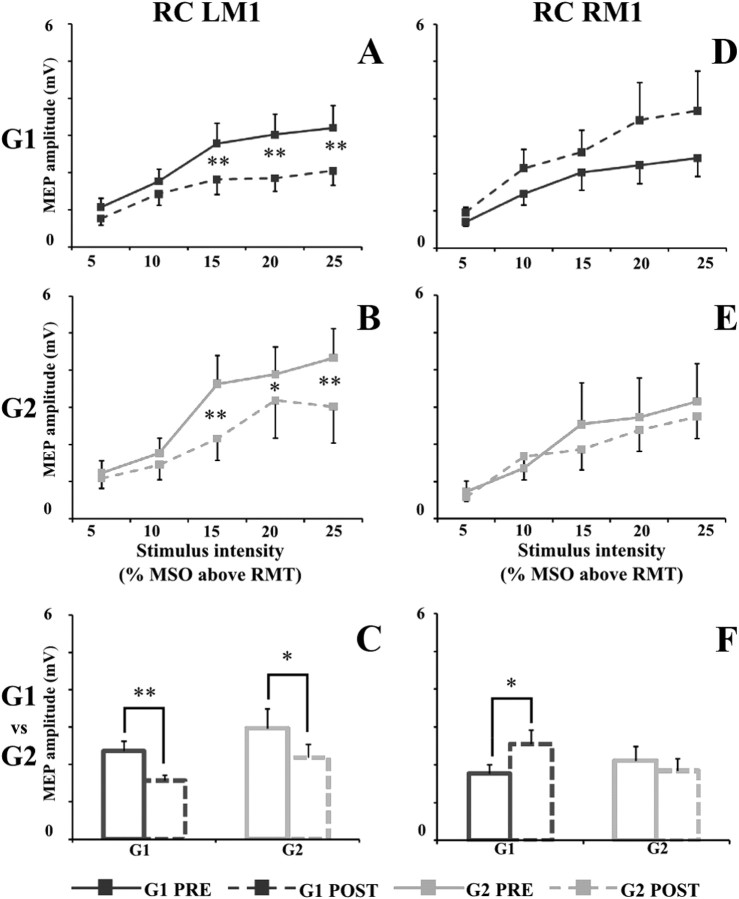
Left and right motor cortex RC in G1 (dark gray square) and G2 (light gray square) before (PRE; solid line) and after (POST; dashed line) immobilization. A (G1) and B (G2) illustrate the MEP recruitment curve (peak-to-peak amplitude, in millivolts, on the ordinate) of left motor cortex (LM1), whereas D (G1) and E (G2) illustrate the MEP recruitment curve of right motor cortex (RM1). On the abscissa, the stimulus intensities are shown (5, 10, 15, 20, and 25% of MSO above RMT). On C and F, the mean values of MEP sizes in G1 (dark gray) and G2 (light gray) before (solid line) and after (dashed line) immobilization are shown. Data are represented as mean values ± SE. In A, B, D, and E, asterisks indicate significant difference between pre and post values when interaction of time × intensity was statistically significant. In C and F, asterisks indicate the main effect of time. *p < 0.05, **p < 0.01.

