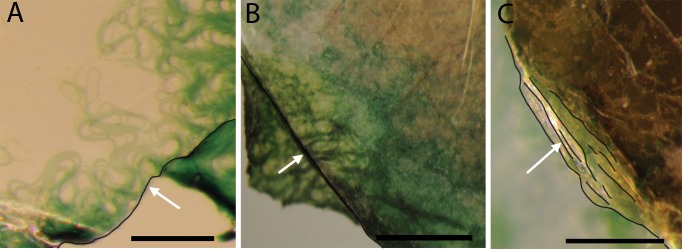
Fig 3. Stereo microscope images showing infiltration of filamentous cyanobacteria into various mica sheets after two weeks of growth.
Images were taken looking down the c-axis, per experimental setup (Fig 1A). The edges of mineral sheets are highlighted with black curves. (A) shows infiltration of green cyanobacterial cells into sheets of muscovite (the direction of infiltration is from the lower right corner of the image to the upper left, as indicated by the white arrow. Scale bar is 100 microns; (B) shows infiltration into phlogopite (from the lower left to the upper right direction, as indicated by the white arrow). Scale bar is 50 microns; and (C) shows growth into multiple sheets of biotite (from the lower left to the upper right direction). Scale bar is 50 microns.

